Awesomeness Round-Up – 8/24/2012
- By Alexe Helmke
- August 24, 2012
- Comments Off on Awesomeness Round-Up – 8/24/2012
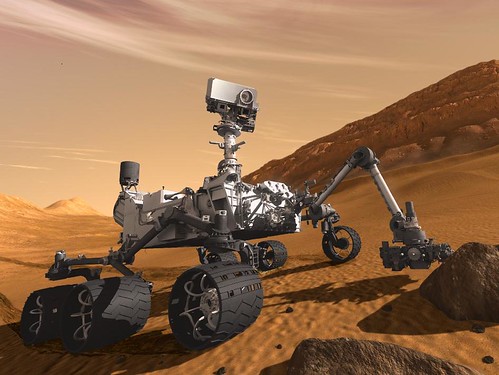
Credit: NASA/JPL-Caltech
Curiosity has successfully made it to Mars! While it’s gotten a generous amount of press in recent days, we wanted add our own nod to the successful landing of the Mars Science Laboratory aboard its rover, Curiosity, (after its Seven Minutes of Terror) at 1:32 a.m. EDT, Aug. 6, 2012 (10:32 p.m. PDT on Aug. 5, 2012). Since then it has proceeded with its set up to get itself fully up and running in order to study the red planet.
The rover, launched Nov. 26, 2011, hosts a myriad of instruments that will allow it to analyze the martian landscape. The Mars Science Laboratory (MSL) is about the size of a small SUV and carries with it three cameras, several spectrometers, as well as radiation detectors, environmental sensors, and atmospheric sensors. This mission is part of NASA’s Mars Exploration Program, a long-term effort of robotic exploration of the red planet. Curiosity was designed to assess whether Mars ever had an environment able to support small life forms called microbes. In other words, its mission is to determine the planet’s “habitability.” The rover will analyze samples scooped from the soil and drilled from rocks. The record of the planet’s climate and geology is essentially written in the rocks and soil — in their formation, structure, and chemical composition. The rover’s onboard laboratory will study rocks, soils, and the local geologic setting in order to detect chemical building blocks of life (e.g., forms of carbon) on Mars and will assess what the martian environment was like in the past. We look forward to all that we can learn about Mars from the MSL aboard Curiosity.
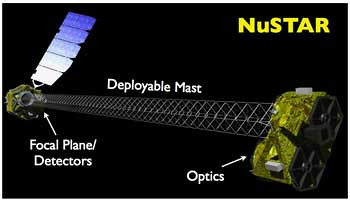
Credit: JPL/Caltech
It’s time to check in with our recently launched space telescope, NuSTAR. A mission status report announced that NASA’s Nuclear Spectroscopic Telescope Array (NuSTAR) passed its Post-Launch Assessment Review at JPL this week, clearing the way for the mission to enter into its science operations phase later this month. Since opening its “eyes” on its first-light images of the galactic black hole Cygnus X-1 on June 28, NuSTAR has been observing bright X-ray sources across the sky as part of the instrument commissioning. Recently, NuSTAR participated in a group observing run with several other telescopes to observe the quasar 3C 273. The coordinated observations of this source that varies in brightness over time will allow X-ray satellites to measure how sensitive they are to these energies as well as perform some scientific investigations. Soon, NuSTAR will begin its hunt for hidden black holes in our galaxy and beyond!
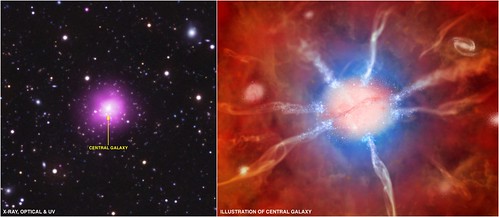
Credit: X-ray: NASA/CXC/MIT/M.McDonald; UV: NASA/JPL-Caltech/M.McDonald; Optical: AURA/NOAO/CTIO/MIT/M.McDonald; Illustration: NASA/CXC/M.Weiss
Astronomers have found an extraordinary galaxy cluster that is breaking several important cosmic records. The recently discovered Phoenix Cluster was observed by NASA’s Chandra X-ray Observatory, the National Science Foundation’s South Pole Telescope, and eight other world-class observatories. What they’re seeing may force astronomers to rethink how these colossal structures and the galaxies that inhabit them evolve over time.
Galaxy clusters are groups of hundreds of galaxies all bound together by gravity. They are the largest objects in our universe and often contain a large amount of hot gas between the galaxies that can only be detected by X-ray telescopes like Chandra. The gas in the Phoenix cluster is giving off lots of X-rays which means the gas is cooling quickly over time, especially near the center of the cluster, causing gas to flow inwards and form huge numbers of stars. Most clusters, however, have formed very few stars in the past few billion years. Astronomers think that this happens because a supermassive black hole in the central galaxy of the cluster pumps so much energy into the system. If the black hole is heating up the gas nearby, the gas can’t cool and coalesce into new stars. The Perseus Cluster is a good example – Repeated outbursts from the black hole in the center of Perseus, in the form of powerful jets, produced sound waves with an incredibly deep B-flat note 57 octaves below middle C. Shock waves, much like sonic booms in Earth’s atmosphere, and the very deep sound waves release energy into the gas, preventing most of it from cooling.
This is where the Phoenix Cluster seems to be unique. The jets from the giant black hole in its central galaxy are not powerful enough to prevent the cluster gas from cooling. So any deep notes produced by the jets must be much weaker than needed to prevent cooling and star formation. Because the power of the black hole isn’t doing much to slow down the creation of new stars, stars are forming in the Phoenix Cluster at the highest rate ever observed for the middle of a galaxy cluster. It will be interesting to see what this giant galaxy cluster with its host of brand new stars can tell us about how these enormous structures evolve as studies continue.
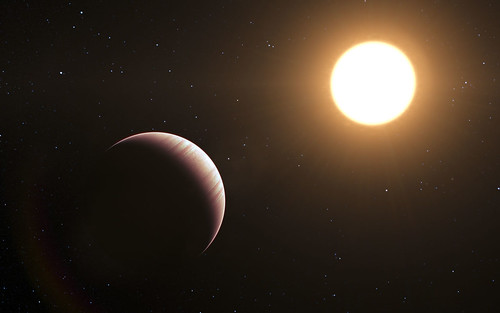
Credit: ESO/L. Calçada
For the first time astronomers have been able to study the atmosphere of an exoplanet in detail thanks to a new clever trick. The focus of the study was Tau Bootis b, portrayed in the artists concept above, which was one of the first exoplanets to be discovered back in 1996. Tau Bootis b is a large “hot Jupiter” planet orbiting very close to its parent star. Like most exoplanets, this planet does not transit the disc of its star from our perspective. Up until now these transits were essential to studying the planet’s atmosphere because the light from the star contains an imprint of the properties of the atmosphere of the planet. But now, after 15 years of attempting to study the faint glow that is emitted from “hot Jupiter” exoplanets, astronomers have finally succeeded in probing the structure of the atmosphere of Tau Boötis b as well as deducing its mass accurately for the first time. The team used the Very Large Telescope (VLT) at ESO’s Paranal Observatory in Chile combining high quality infrared information and a clever new trick to tease out the weak signal of the planet from the much stronger one from the parent star. The team was able to probe the atmosphere of Tau Bootes and measured the amount of carbon monoxide present, as well as the temperature at different altitudes. What they found was not what they expected – an atmosphere with a temperature that falls higher up. This result is the exact opposite of the atmospheric data found for other hot Jupiter exoplanets. With this clever new trick in the toolbox, astronomers will continue to study more exoplanets like Tau Bootis b to see what information they can give us.
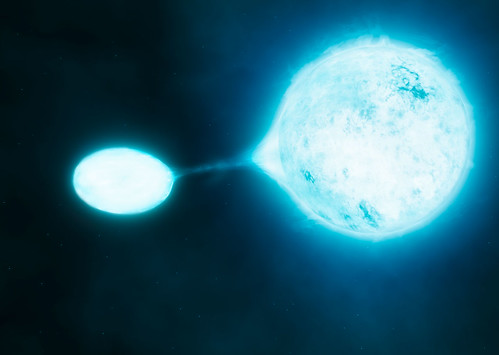
Credit: ESO/M. Kornmesser/S.E. de Mink
A new study using ESO’s Very Large Telescope (VLT) has shown that most very bright high-mass stars do not live alone. Almost three quarters of these large, bright stars have close a companion star (far more than previously thought). An international team using the VLT has been studying O-type stars which have very high mass, temperature, and brightness. These stars have short and violent lives and play a key role in the evolution of galaxies. The team discovered that 75% of these O-stars exist in binary systems (where the two stars orbit each other). This is a higher fraction than previously thought and the first time it has been precisely determined. More importantly, though, they found that a large proportion of these pairs are close enough to interact (through stellar mergers or transfer of mass by so-called “vampire stars” like the artist concept above), which has profound implications for our understanding of galaxy evolution.
O-stars make up a fairly small portion of the entire population of stars, but because there are violent events associated with them, they can have a great impact on the regions around them. The winds and shocks coming from these stars can both trigger and stop star formation, their radiation powers the glow of bright nebulae, and their supernovae enrich galaxies with the heavy elements crucial for life. In short, O-stars are closely tied to the mechanisms that drive the evolution of galaxies. It now appears that it is relatively common for these large stars to orbit in close binary systems which drastically affect their evolution and lifetimes. For example the smaller star is rejuvenated as it sucks the fresh hydrogen from its companion. Its mass will increase substantially and it will outlive its companion, surviving much longer than a single star of the same mass would. The victim star, meanwhile, is stripped of its envelope before it has a chance to become a luminous red super giant. Instead, its hot, blue core is exposed. As a result, the stellar population of a distant galaxy may appear to be much younger than it really is. Understanding these fascinating systems is extremely important for our understanding of galactic evolution and much more study is required.
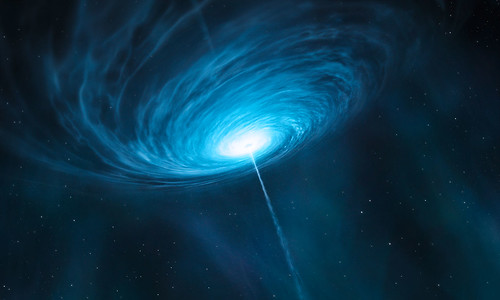
Credit: ESO/M. Kornmesser
Astronomers were able to make the sharpest direct observation ever of the center of a distant galaxy. By connecting APEX, in Chile, to the Submillimeter Array (SMA) in Hawaii and the Submillimeter Telescope (SMT) in Arizona. They were able to see the bright quasar 3C 279 with more detail than ever before. Quasar 3C 279 (artist concept above) is more than 5 billion light years away and contains a supermassive black hole with a mass about one billion times that of the Sun. The telescopes were linked using a technique known as Very Long Baseline Interferometry (VLBI).
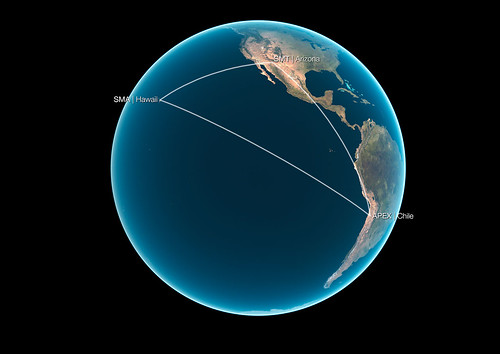
Credit: ESO/L. Calçada
Larger telescopes can make sharper observations, and interferometry allows multiple telescopes to act like a single telescope as large as the separation — or “baseline” — between them. Using VLBI, the sharpest observations can be achieved by making the separation between telescopes as large as possible. For their quasar observations, the team used the three telescopes to create an interferometer with transcontinental baseline lengths of 9447 km from Chile to Hawaii, 7174 km from Chile to Arizona and 4627 km from Arizona to Hawaii. Connecting APEX in Chile to the network was crucial, as it contributed the longest baselines. The observations represent a new milestone towards imaging supermassive black holes and the regions around them. With this as a first step, there are hopes of connecting even more telescopes in this effort in order to image the shadow of the supermassive black hole in our own Milky Way galaxy as well as others nearby.
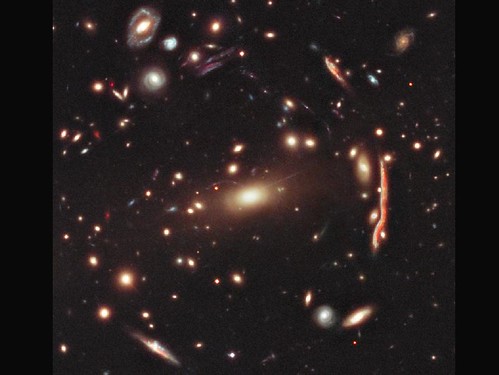
Credit: NASA, ESA, M. Postman (STScI), and the CLASH Team
Astronomers have constructed the largest-ever three-dimensional map of massive galaxies and distant black holes, which will help the investigation of the mysterious “dark matter” and “dark energy” that make up 96 percent of the universe. The map was produced by the Sloan Digital Sky Survey III (SDSS-III). Early last year, the SDSS-III released the largest-ever image of the sky, which covered one-third of the night sky. The new data, “Data Release 9” (DR9), begins expansion of this earlier image into a full three-dimensional map. By constructing a map like this, scientists can retrace the history of the universe over the last seven billion years. With that history, they can get better estimates for how much of the universe is made up of “dark matter” — matter that we can’t directly see because it doesn’t emit or absorb light — and “dark energy,” the even more mysterious force that is driving the accelerating expansion of the universe. Although we do not understand dark matter and dark energy, we can infer their presence through their effect on the objects and regions around them. For example, in the image above, we cannot see dark matter, but we know it must be there because it is lensing distant galaxies behind it – note the smeared galaxies toward the edge of the image.
This map of the universe is the centerpiece of DR9. It includes images of 200 million galaxies and spectra of 1.35 million galaxies. Spectra show how much light a galaxy gives off at different wavelengths. Because this light is shifted to longer redder wavelengths as the universe expands, spectra allow scientists to figure out how much the universe has expanded since the light left each galaxy. The galaxy images, plus these measurements of expansion, are combined by SDSS-III scientists to create the three-dimensional map released with DR9. Distant “quasars” provide another way to measure the distribution of matter in the universe. Quasars are the brightest objects in the distant universe and their spectra show intricate patterns imprinted by the large-scale clumping of intergalactic gas and underlying dark matter that lies between each quasar and the Earth. These new data are not only helping us understand the distant universe, but also our own Milky Way Galaxy. It is hoped with better estimates that we could look back into our galaxy’s history and see how smaller galaxies combined to form the Milky Way that we live in today.