
Multiwavelength Milky Way Science Users
On this page:
- About the Images
- Original Data File Information
- Image Descriptors
- Related Site Links
- Map Intensity Scales (separate page)
This "Science Users" portion of the Multiwavelength Milky Way Project is intended primarily for use by the astronomical community. As such, this page includes technical references and links to data sets not present on the Education pages.
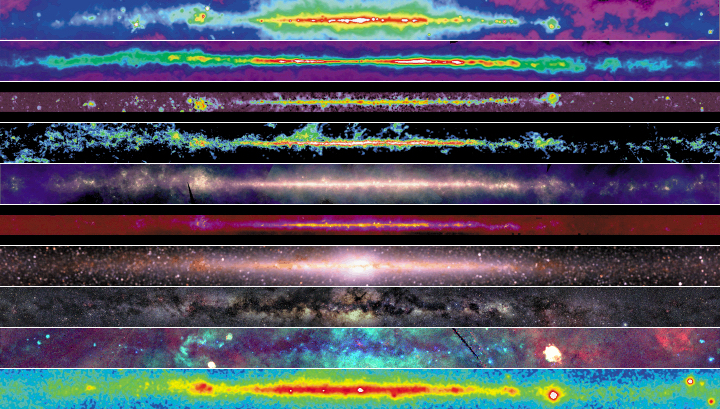
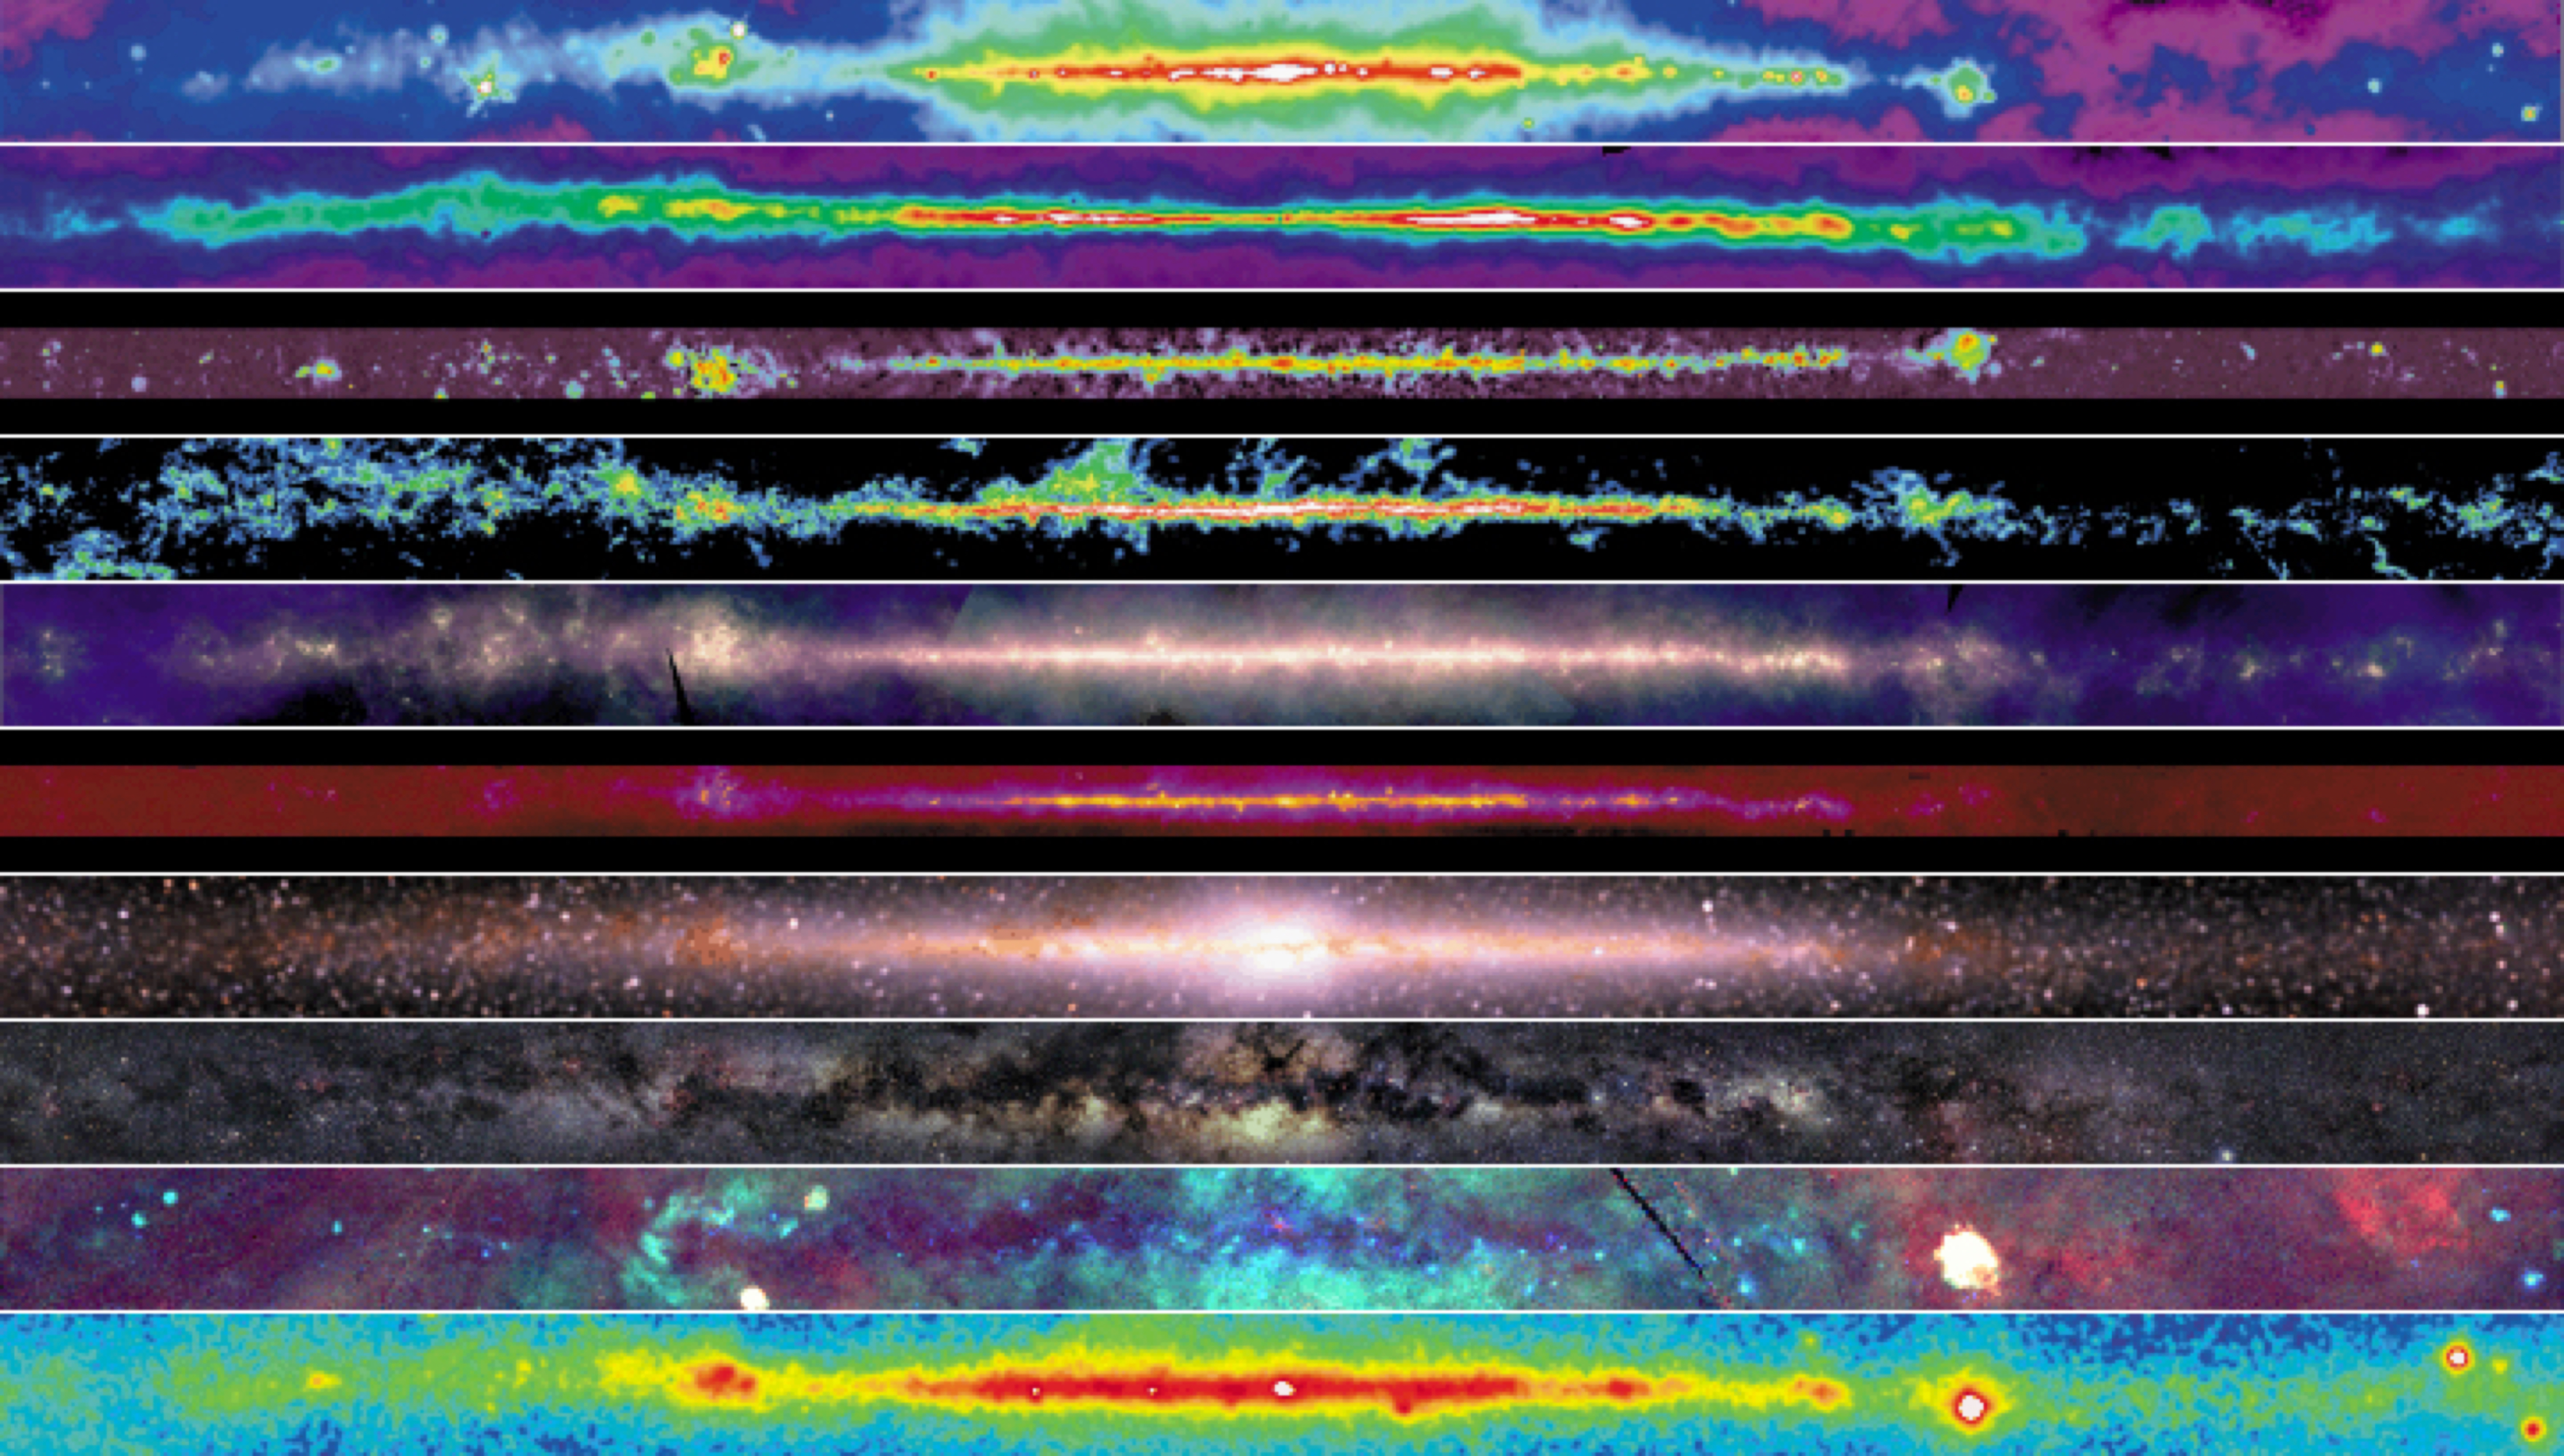
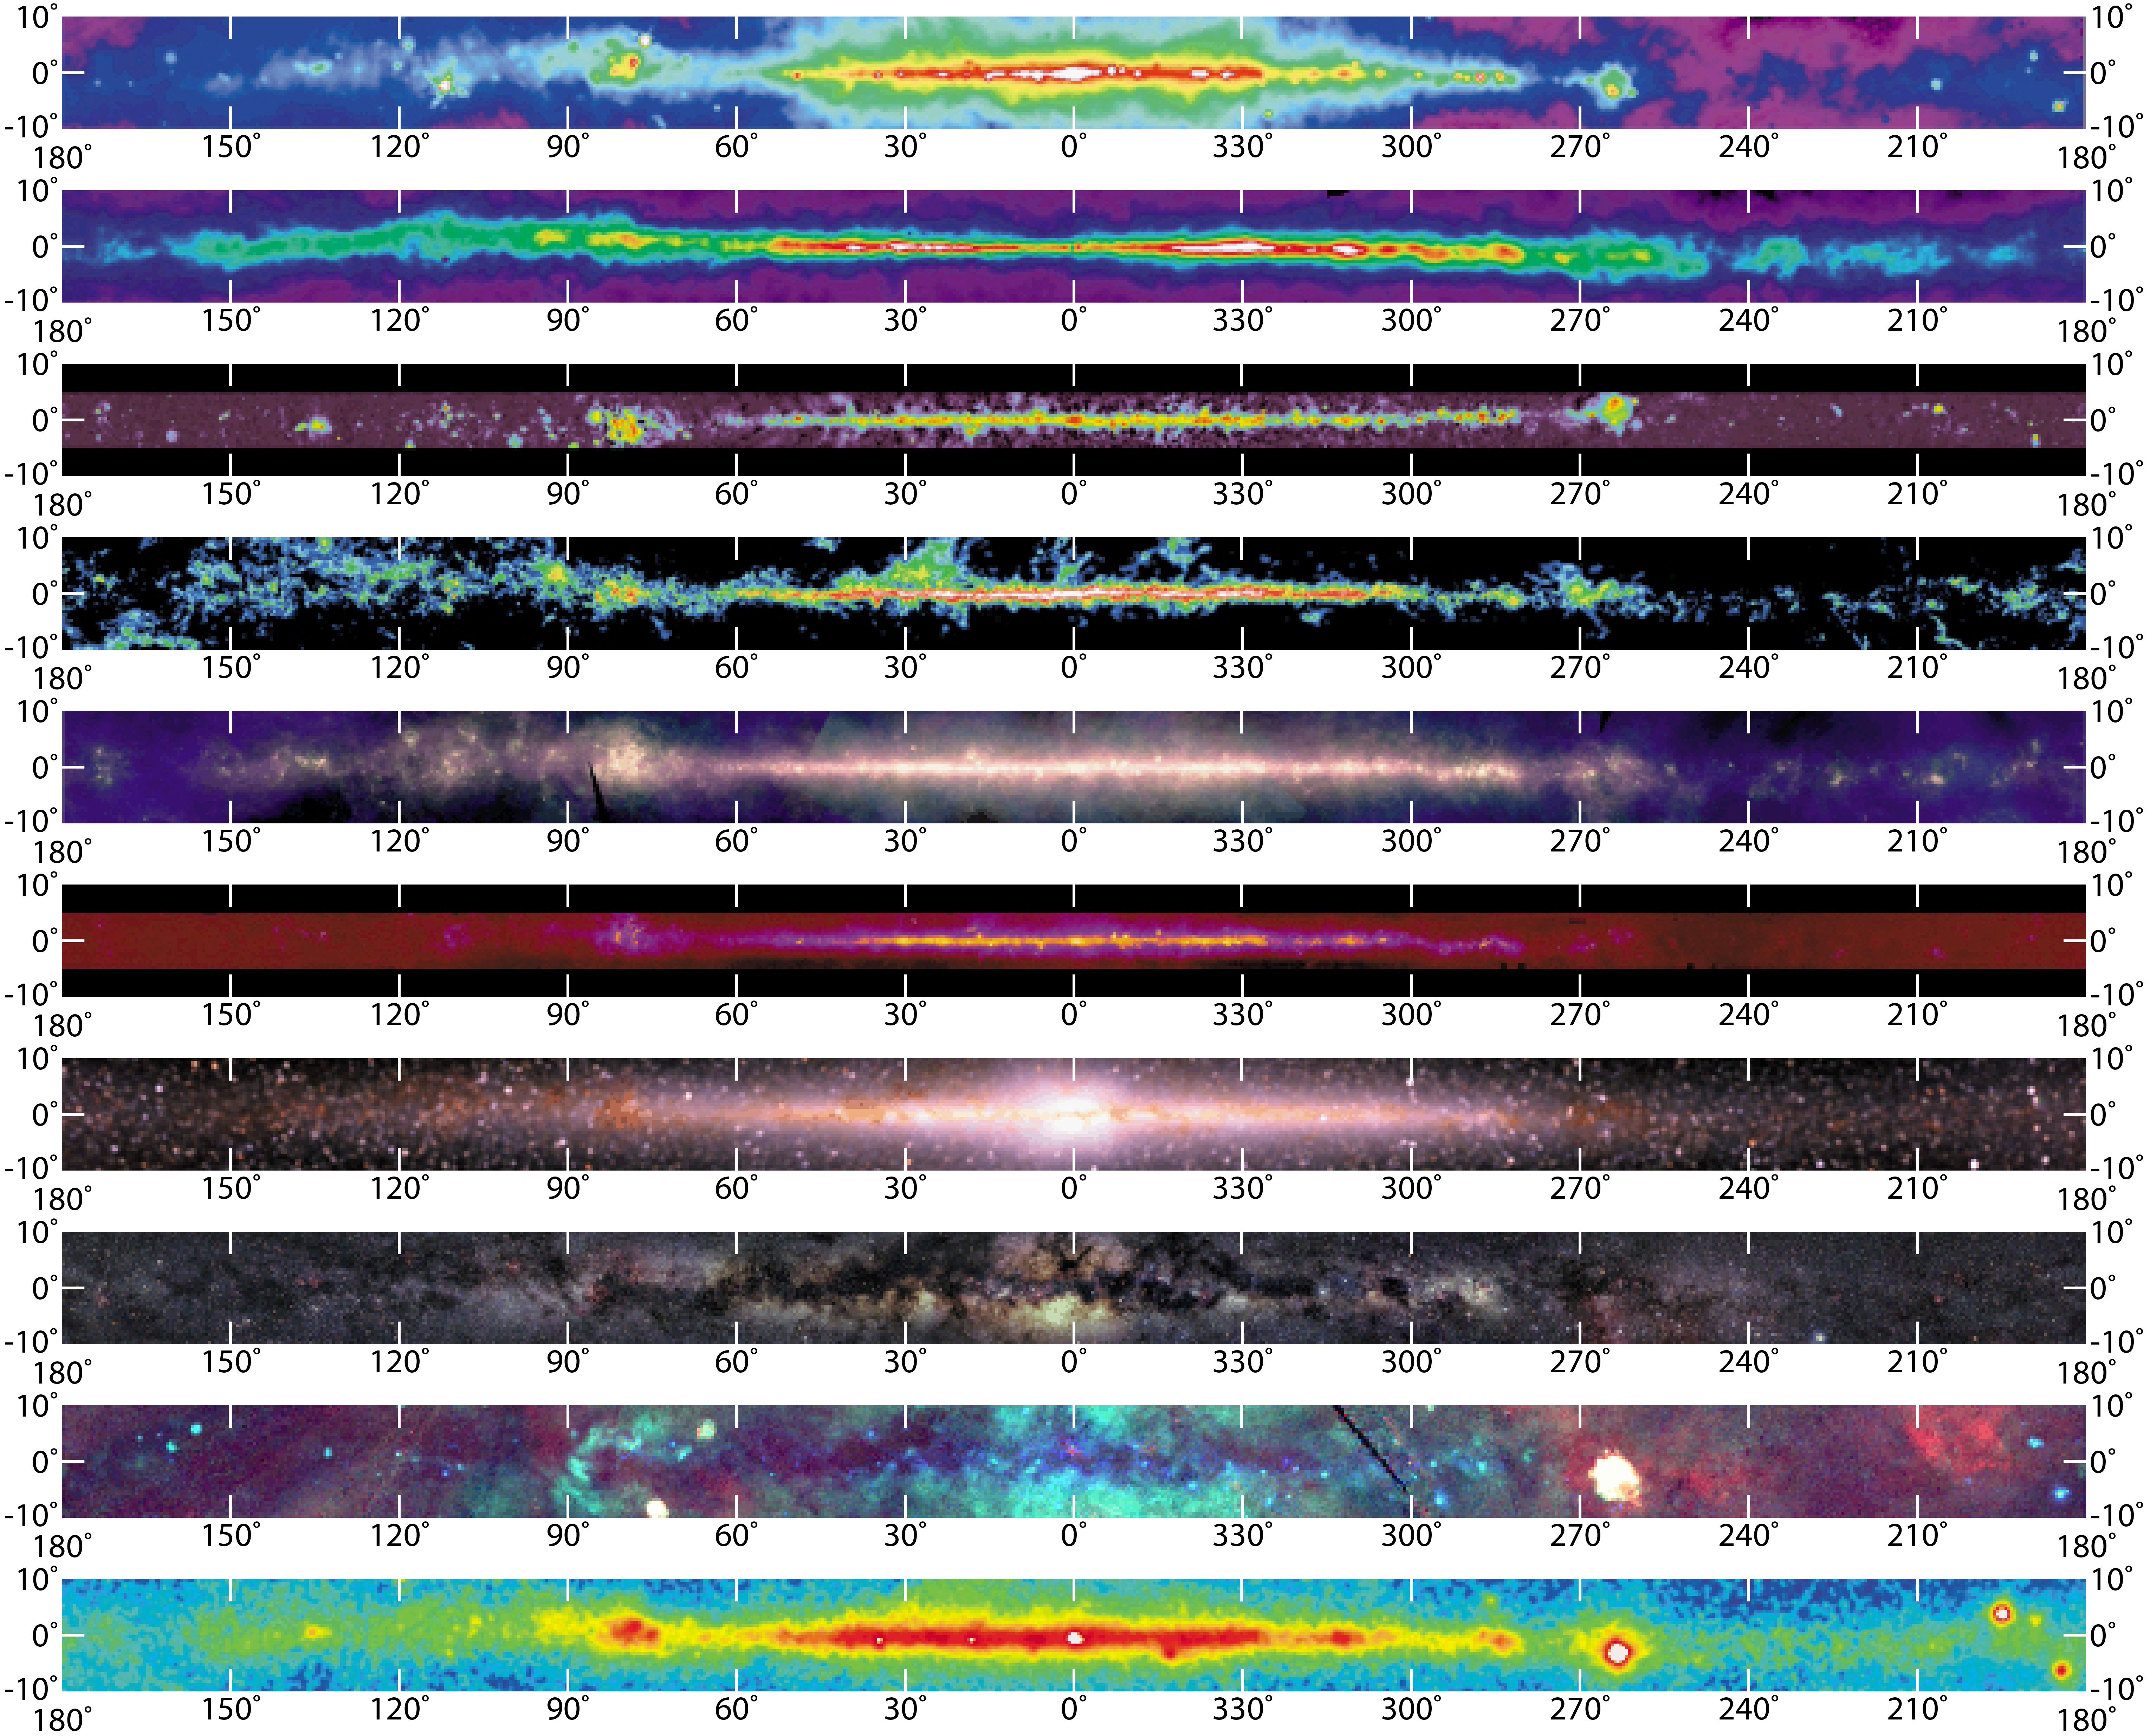
Presented here are maps of the Milky Way galaxy at ten wavelength regions. The maps are constrained to +/- ten degrees of the Galactic plane. Below the maps is a finder chart.
Clicking on the map name, above each map, will connect you to a brief description of the Milky Way at that wavelength (these descriptions can also be accessed by scrolling down this page). Within the descriptions are technical references and links to online data access.
Multiple levels of magnification are available for each wavelength, as our views with and without galactic latitude and longitude information (labelled with "Grid"). Below the finder map, a combined view is available so you can directly compare the different wavelengths.
Maps
Radio Continuum (408 MHz)
![]()
1x,
1x Grid,
4x,
4x Grid,
8x,
8x Grid
Atomic Hydrogen
![]()
1x,
1x Grid,
4x,
4x Grid,
8x,
8x Grid
Radio Continuum (2.4 - 2.7 GHz)
![]()
1x,
1x Grid,
4x,
4x Grid,
8x,
8x Grid
Molecular Hydrogen
![]()
1x,
1x Grid,
4x,
4x Grid,
8x,
8x Grid
Mid Infrared
![]()
1x,
1x Grid,
4x,
4x Grid,
8x,
8x Grid
Mid Infrared
![]()
1x,
1x Grid,
4x,
4x Grid,
8x,
8x Grid
Near Infrared
![]()
1x,
1x Grid,
4x,
4x Grid,
8x,
8x Grid
Optical
![]()
1x,
1x Grid,
4x,
4x Grid,
8x,
8x Grid
X-Ray
![]()
1x,
1x Grid,
4x,
4x Grid,
8x,
8x Grid
Gamma Ray
![]()
1x,
1x Grid,
4x,
4x Grid,
8x,
8x Grid
Combined View
1x, 1x Grid, 4x, 4x Grid, 8x, 8x Grid
The Images
The Milky Way Galaxy is generally considered an Sbc-type galaxy. It has a central bulge of stars and spiral arms of gas and stars in a disk. We view the Milky Way essentially edge-on from our perspective near the plane of the disk and 28,000 light years from the Galactic center. In recent decades, Galactic astronomy has benefitted from a tremendous broadening of coverage of the electromagnetic spectrum by ground-based and spaced-based instruments. Presented above are images of the sky near the Galactic plane in spectral lines and continuum bands spanning a frequency range of more than 14 orders of magnitude.
The images are derived from several space and ground-based surveys, many of which are available through the National Space Science Data Center at NASA Goddard Space Flight Center.
Each image represents a 360° false color view of the Milky Way within 10° of the plane; the images are in Galactic coordinates with the direction of the Galactic center in the center of each. For scale, the vertical dimension of each image is forty times the angular diameter of the full moon on the sky; the areas shown represent about one-sixth of the entire sky. The image in the finder chart is derived from the IRAS 100 micron map with COBE DIRBE 3.5 micron contours overlaid.
The images shown on this website were created by Mr. Jay Friedlander (SED Visualization Lab Task Lead) in consultation with Dr. Seth Digel.
Original Data Files
For users interested in quantitative examination of the maps, the actual data files corresponding to most of the images are available for retrieval by anonymous ftp. These were derived from the surveys cited below and in most cases were transformed and interpolated to lie on regular grids in Galactic coordinates, with sampling appropriate to the resolution.
The files are not known to contain errors, but the user is advised to check any scientific results against the data from the original sources. The user is also referred to the original references for descriptions of backgrounds, sensitivities, resolutions, and other considerations relevant to the interpretation of the data.
The files are compressed and in FITS image format, a binary format commonly used in astronomy. The infrared, near-infrared, and X-ray images contain three planes, one for each band represented in the corresponding image in the poster. The optical image is divided into four parts, by Galactic quadrant, because it is very large. Descriptions of the FITS standard and links to software for reading and displaying FITS images are available from the FITS Support Office at NASA/GSFC.
Notes on the production of the individual maps are included in the headers of the files.
Digital versions of several of the original surveys may be accessed, and images of selected fields constructed, online via the SkyView service. The complete data for some of the surveys are available via the World Wide Web; links are listed in the relevant sections.
Map Descriptions
Radio Continuum (408 MHz)
Intensity of radio continuum emission from high-energy charged particles in the Milky Way,from surveys with ground-based radio telescopes (Jodrell Bank Mark I and Mark IA, Bonn 100-meter, and Parkes 64-meter). At this frequency, most of the emission is from electrons moving through the interstellar magnetic field at nearly the speed of light. Shock waves from supernova explosions accelerate electrons to such high speeds, producing especially intense radiation near these sources. Emission from the supernova remnant Cas A near 110° longitude is so intense that the diffraction pattern of the support legs for the radio receiver on the telescope is visible as a cross shape.
Online data access:
https://astro.uni-bonn.de/en
Frequency: 408 MHz
Intensities: 10-4250 K
Angular resolution: 51'
Atomic Hydrogen
Column density of atomic hydrogen,derived on the assumption of optically thin emission, from radio surveys of the 21-cm transition of hydrogen. The 21-cm emission traces the "cold and warm" interstellar medium, which on a large scale is organized into diffuse clouds of gas and dust that have sizes of up to hundreds of light-years. Most of the image is based on the Leiden-Dwingeloo Survey of Galactic Neutral Hydrogen using the Dwingeloo 25-m radio telescope; the data were corrected for sidelobe contamination in collaboration with the University of Bonn.
References:
Burton, W. B. 1985, Astron. Astrophys. Suppl. Ser., 62, 365
Hartmann, Dap, & Burton, W. B., "Atlas of Galactic Neutral Hydrogen," Cambridge Univ. Press, (1997, book and CD-ROM)
Kerr, F. J., et al. 1986, Astron. Astrophys. Suppl. Ser.
Online data access:
Atlas of Neutral Hydrogen (1997)
Frequency: 1.4 GHz
Column densities: 10 x 1020 -230 x 1020 cm-2
Angular resolution: 45-60'
Radio Continuum (2.4 - 2.7 GHz)
Intensity of radio continuum emission from hot, ionized gas and high-energy electrons in the Milky Way, from surveys with both the Bonn 100-meter, and Parkes 64-meter radio telescopes. Unlike most other views of our Galaxy presented here, these data extend to latitudes of only 5° from the Galactic plane. The majority of the bright emission seen in the image is from hot, ionized regions, or is produced by energetic electrons moving in magnetic fields. The higher resolution of this image, relative to the 408 MHz picture above, shows Galactic objects in more detail. Note that the bright "ridge" of Galactic radio emission, appearing prominently in the 408 MHz image, has been subtracted here in order to show Galactic features and objects more clearly.
References:
Duncan, A. R., Stewart, R. T., Haynes, R. F., & Jones, K. L. 1995, Mon. Not. Roy. Astr. Soc., 277, 36
Fuerst, E., Reich, W., Reich, P., & Reif, K. 1990, Astron. Astrophys. Suppl. Ser., 85, 691
Reich, W., Fuerst, E., Reich, P., & Reif, K. 1990, Astron. Astrophys. Suppl. Ser., 85, 633
Online data access:
Survey data from the Max-Planck-Institut fuer Radioastronomie
http://www.atnf.csiro.au/database/astro_data/2.4Gh_Southern
Frequency: 2.4-2.7 GHz
Intensities: 0-430 K
Angular resolution: 10.4'
Molecular Hydrogen
Column density of molecular hydrogen inferred from the intensity of the J =1-0 spectral line of carbon monoxide, a standard tracer of the cold, dense parts of the interstellar medium. Such gas is concentrated in the spiral arms in discrete "molecular clouds." Most molecular clouds are sites of star formation. The molecular gas is pre-dominantly H2, but H2 is difficult to detect directly at interstellar conditions and CO, the second most abundant molecule, is observed as a surrogate. The column densities were derived on the assumption of a constant proportionality between the column density of H2 and the intensity of the CO emission.
References:
Dame, T. M., Hartmann, Dap, & Thaddeus, P. 2001, Astrophysical Journal, 547, 792
Online data access:
CO data (1987 Dame et al. composite survey) from ADC archives
Frequency: 115 GHz
Column densities: 12 x 1020 -285 x 1020 cm-2
Angular resolution: 9-30'
Infrared
Composite mid-and far-infrared intensity observed by the Infrared Astronomical Satellite (IRAS) in 12, 60, and 100 micron wavelength bands. The images are encoded in the blue, green, and red color ranges, respectively. Most of the emission is thermal, from interstellar dust warmed by absorbed starlight, including star-forming regions embedded in interstellar clouds. The display here is a mosaic of IRAS Sky Survey Atlas images. Emission from interplanetary dust in the solar system, the "zodiacal emission," was modeled and subtracted in the production of the Atlas.
Reference:
Wheelock, S. L., et al. 1994, IRAS Sky Survey Atlas Explanatory Supplement, JPL Publication 94-11 (Pasadena: JPL) Order: CASI HC A08/MF A02
Online data access:
IRAS pages at IPAC
LAMBDA interface to all released IRAS data products
Frequencies: 3.0 x 10³-25 x 103 GHz
Intensities: 0.25-100 (12 microns), 1.5-750 (60 microns), 12-750 MJy sr-1 (100 microns)
Angular resolution: 5'
Mid-infrared
Mid-infrared emission observed by the SPIRIT III instrument on the Midcourse Space Experiment (MSX) satellite. Most of the diffuse emission in this wavelength band is believed to come from complex molecules called polycyclic aromatic hydrocarbons, which are commonly found both in coal and interstellar gas clouds. Red giant stars, planetary nebulae, and massive stars so young that they remain deeply embedded in their parental molecular gas clouds produce the multitude of small bright spots seen here. Unlike most of the other maps, this map extends only to 5° above and below the Galactic plane.
Reference:
Price, S. D., et al. 2001, Astron. J., 121, 2819
Online data access:
http://irsa.ipac.caltech.edu/Missions/msx.html
Frequencies: 2.8 x 10⁴-4.4 x 10⁴ GHz
Intensities: 2.8-107 MJy sr-1
Angular resolution: 0.4'
Near Infrared
Composite near-infrared intensity observed by the Diffuse Infrared Background Experiment (DIRBE) instrument on the Cosmic Background Explorer (COBE) in the 1.25, 2.2, and 3.5 micron wavelength bands. The images are encoded in the blue, green, and red color ranges, respectively. Most of the emission at these wavelengths is from relatively cool giant K stars in the disk and bulge of the Milky Way. Interstellar dust does not strongly obscure emission at these wavelengths; the maps trace emission all the way through the Galaxy, although absorption in the 1.25 micron band is evident toward the Galactic center region.
Online data access:
COBE data from the COBE Home Page
Frequencies: 86 x 103-240 x 103 GHz
Intensities: 0.5-9 (1.25 microns), 0.35-20 (2.2 microns), 0.22-4.5 MJy sr-1 (3.5 microns)
Angular resolution: 42'
Optical
Intensity of visible (0.4 - 0.6 micron) light from a photographic survey. Due to the strong obscuring effect of interstellar dust,the light is primarily from stars within a few thousand light-years of the Sun, nearby on the scale of the Milky Way. The widespread bright red regions are produced by glowing, low-density gas. Dark patches are due to absorbing clouds of gas and dust, which are evident in the Molecular hydrogen and Infrared maps as emission regions. Stars differ from one another in color, as well as mass, size and luminosity. Interstellar dust scatters blue light preferentially, reddening the starlight somewhat relative to its true color and producing a diffuse bluish glow. This scattering, as well as absorption of some of the light by dust, also leaves the light diminished in brightness. The panorama was assembled from sixteen wide-angle photographs taken by Dr. Axel Mellinger using a standard 35-mm camera and color negative film. The exposures were made between July 1997 and January 1999 at sites in the United States, South Africa, and Germany. The image processing and mosaicing procedures are described in the document cited below. Image courtesy of A. Mellinger.
Reference:
Mellinger, A., Creating a Milky Way Panorama
Frequency: 460 x 103 GHz
Online data access:
http://home.arcor-online.de/axel.mellinger/
Intensities: uncalibrated
Angular resolution: 1.5'
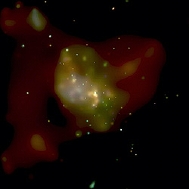
X-Ray
Composite X-ray intensity observed by the Position-Sensitive Proportional Counter (PSPC) instrument on the Röntgen Satellite (ROSAT). Images in three broad, soft X-ray bands centered at 0.25 , 0.75, and 1.5 keV are encoded in the red, green, and blue color ranges, respectively. In the Milky Way, extended soft X-ray emission is detected from hot, shocked gas. At the lower energies especially, the interstellar medium strongly absorbs X-rays, and cold clouds of interstellar gas are seen as shadows against background X-ray emission. Color variations indicate variations of absorption or of the temperatures of the emitting regions. The black regions indicate gaps in the ROSAT survey.
Reference:
Snowden, S. L., et al. 1997 Astrophys. J., 485, 125
Online data access:
ROSAT All-Sky Survey at MPE
ROSAT data archives at the HEASARC
Frequency: 60-360 x 106 GHz
Intensities: 0-20 (0.25 keV), 0-10 (0.75 keV), 0-10 x 10-4 photons arcmin-2 s-1 (1.5 keV)
Angular resolution: 12'
Gamma Ray
Intensity of high-energy gamma-ray emission observed by the Energetic Gamma-Ray Experiment Telescope (EGRET) instrument on the Compton Gamma-Ray Observatory (CGRO). The image includes all photons with energies greater than 300 MeV. At these extreme energies, most of the celestial gamma rays originate in collisions of cosmic rays with hydrogen nuclei in interstellar clouds. The bright, compact sources near Galactic longitudes 185°, 195°, and 265° indicate high-energy phenomena associated with the Crab, Geminga, and Vela pulsars, respectively.
References:
Hartman, R. C., et al. 1999, Astrophys. J. Suppl., 123, 79
Hunter, S. D., et al. 1997, Astrophys. J., 481, 205
Online data access:
EGRET Home Page from the Compton Observatory SSC
Frequencies: >7.2 x 10¹³ GHz
Intensities: 3.2 x 10⁻⁶ - 5.5 x 10⁻⁴ photons cm-2 s-1 sr-1
Angular resolution: ~120'
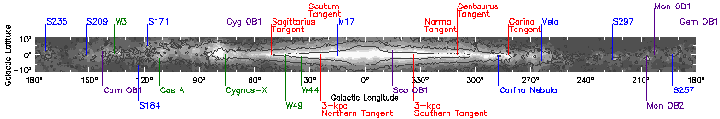
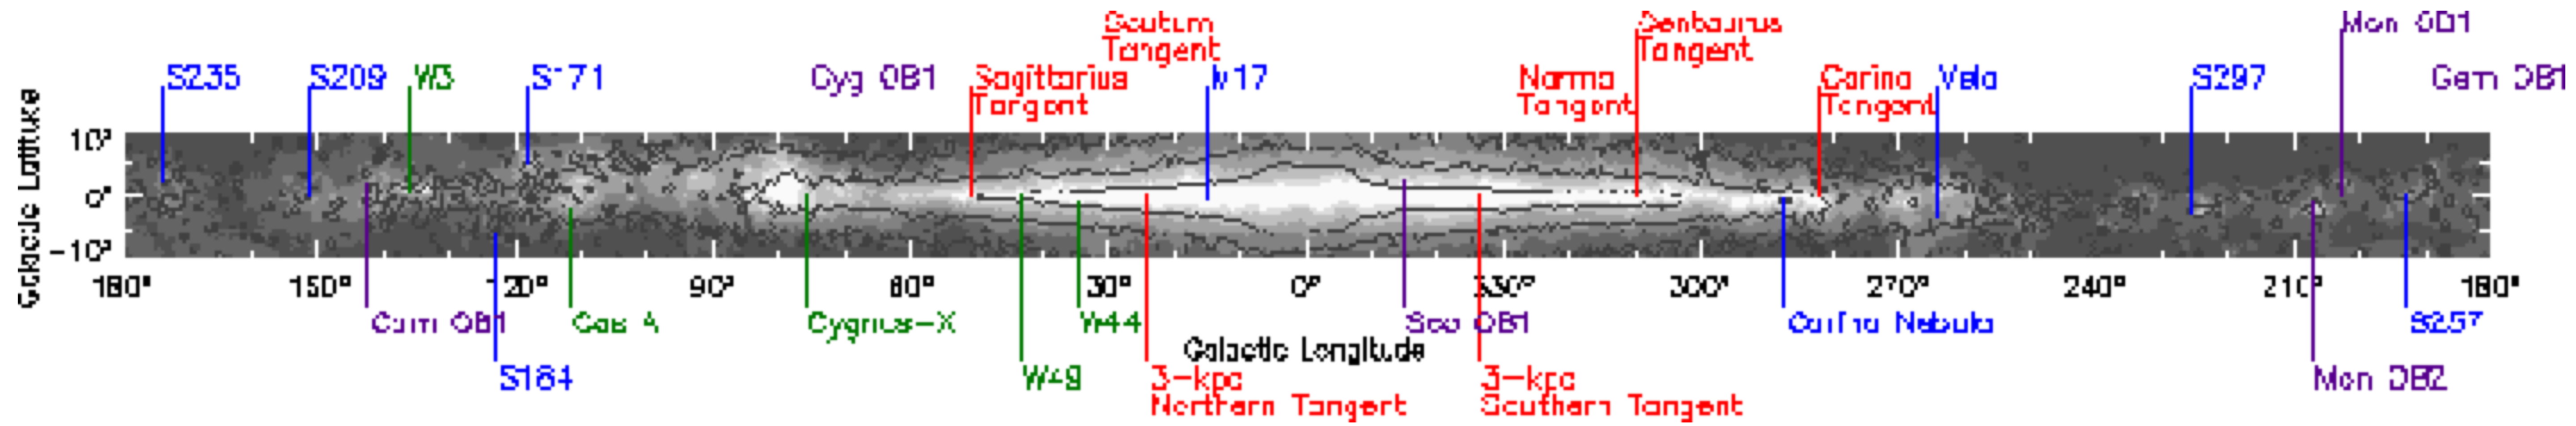
Finder Diagram
Major structural features of the Milky Way (red), optical H II regions (blue), radio sources (green), and OB associations (purple) are labeled in the finder chart. The image in the finder chart is derived from the IRAS 100 micron map of intensity with contours from the COBE DIRBE 3.5 micron map overlaid. The axes of the finder diagram are labelled in degrees of Galactic longitude and latitude.