
Multiwavelength All-Sky Images
![]()
The Astrophysics Data Facility has produced a slide set showing the entire sky in multiple wavelength bands. Small versions of these images are shown below. A composite of these eight images, a composite of the ten panoramic maps (as depicted in the Multiwavelength Milky Way poster and online), and a finder diagram are included in this slide set.
All of the images, with the exception of the one of Atomic Hydrogen, are constructed from the same data sets as used in the Multiwavelength Milky Way poster (The Atomic Hydrogen image is derived from the composite data set of Dickey, J. M., & Lockman, F. J. 1990, ARA&A, 28, 215). Each image shows the entire sky in Aitoff projection, aligned so that the Galactic plane runs horizontally across the center; the Galactic center is toward the center of each. The entire celestial sphere is mapped into these oval-shaped images.
Frequently-Asked Questions
- Where is the Earth in these pictures?
The Earth is not in the images because each represents the whole sky as seen from Earth. Of course, from any location on the ground at most half of the celestial sphere is visible at any given time - the rest is obscured by the Earth. - What are the black stripes?
In the Infrared and X-ray images, the black stripes indicate missing data. Both the IRAS spacecraft, which surveyed the infrared sky, and the ROSAT spacecraft, which surveyed the X-ray sky, operated in a scanning mode, observing one narrow swath of sky in each orbit. If data were lost in transmission or if the instrument were turned off for a span of time, the resulting gap in the coverage appears as a stripe.
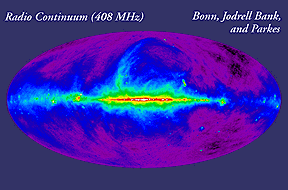
Radio Continuum (408 MHz). Intensity of radio continuum emission from surveys with ground-based radio telescopes (Jodrell Bank MkI and MkIA, Bonn 100 meter, and Parkes 64 meter). At this frequency, most of the emission is from the scattering of free electrons in interstellar plasmas (hot, ionized interstellar gas). Some emission also comes from electrons accelerated in strong magnetic fields. The large arc apparent near the center of the image is known as the North Polar Spur or Loop I, and is the remnant plasma from a supernova explosion that occurred thousands of years ago relatively close to the Sun (on the scale of the Milky Way).
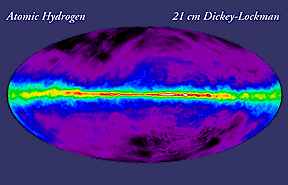
Atomic Hydrogen. Column density of neutral atomic hydrogen from radio surveys of the 21-cm transition of hydrogen. The 21-cm emission traces the "warm" interstellar medium, which on a large scale is organized into diffuse clouds of gas and dust that have sizes of up to hundreds of light years. The data shown here are a composite of several surveys with ground-based telescopes in the northern and southern hemispheres.
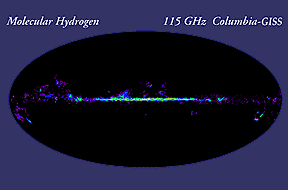
Molecular Hydrogen. Column density of molecular hydrogen (H2) inferred from the intensity of the J = 1-0 line of carbon monoxide (CO). H2 is difficult to observe directly. The ratio of CO to H2 is fairly constant, so it is used instead to trace the cold, dense molecular hydrogen gas. Such gas is concentrated in the spiral arms in discrete "molecular clouds," which are often sites of star formation. The data shown here are a composite of surveys taken with twin 1.2-m millimeter-wave telescopes, one in New York City and the other on Cerro Tololo in Chile.
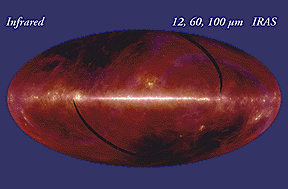
Infrared. Composite of mid and far-infrared intensity images taken by the Infrared Astronomical Satellite (IRAS) in 12, 60, and 100 micron wavelength bands. Most of the emission is thermal, from interstellar dust warmed by absorbed starlight, including star-forming regions embedded in interstellar clouds. Emission from interplanetary dust in the solar system, the "zodiacal emission", was modeled and subtracted in the production of the images. The broad, sideways S-shaped curve traces the ecliptic plane and is the residual from the subtraction.
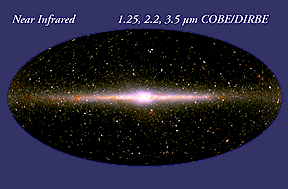
Near Infrared. Composite near-infrared intensity observed by the Diffuse Infrared Background Experiment (DIRBE) instrument on the Cosmic Background Explorer (COBE) in the 1.25, 2.2, and 3.5 micron wavelength bands. Most of the emission is from cool, low-mass K stars in the disk and bulge of the Milky Way. Interstellar dust does not strongly obscure emission at these wavelengths; the maps trace emission all the way through the Galaxy, although absorption in the 1.25 �m band is evident toward the Galactic center region.
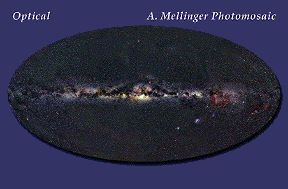
Optical. Intensity of red-band (0.6 micron) visible light from a photomosaic taken with a very wide-field camera at northern and southern observatories. Owing to the strong obscuration by interstellar dust the light is primarily from stars within a few thousand light-years of the Sun, nearby on the scale of the Milky Way, which has a diameter on the order of 100,000 light years. Nebulosity from hot, low-density gas is widespread in the image. Dark patches are due to absorbing dust clouds, which are evident in the Molecular Hydrogen and Infrared maps as emission regions. The photographs do not cover the entire sky, and coordinate distortions in this image have not been corrected.
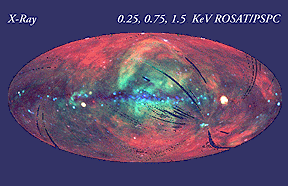
X-Ray. Composite X-ray intensity observations by an instrument on the Roentgen Satellite (ROSAT) in three broad, X-ray bands centered at 0.25 keV, 0.75 keV, and 1.5 keV. Shown is extended soft X-ray emission from tenuous hot gas. At the lower energies the cold interstellar gas strongly absorbs X-rays, and clouds of gas are seen as shadows against background X-ray emission. Color variations indicate variations of the absorption or of the temperatures of the emitting regions. The Galactic plane appears blue because only the highest-energy X-rays can pass through the large column densities of gas. The large loop near the center of the image is the North Polar Spur, an old supernova remnant. Many of the white sources are younger, more compact and more distant supernova remnants.
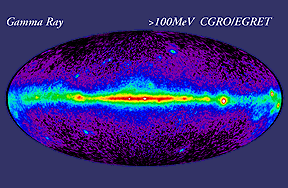
Gamma Ray. Intensity of high-energy gamma-ray emission observed by the Energetic Gamma-Ray Experiment Telescope (EGRET) instrument on the Compton Gamma-Ray Observatory (CGRO). The map includes all photons with energies greater than 100 MeV. At these extreme energies, most of the celestial gamma rays originate in collisions of cosmic rays with nuclei in interstellar clouds, and hence the Milky Way is a diffuse source of gamma-ray light. Superimposed on the diffuse light of the Milky Way are several gamma-ray pulsars, e.g., the Crab, Geminga, and Vela pulsars along the Galactic plane on the right-side of the image. Away from the plane, many of the sources are known to be active Galactic nuclei.