![\scalebox{0.95}[0.95]{\includegraphics[angle=0,width=80mm]{figures/006_density_based_clustering_concept}}](img27.png)
![\scalebox{1.25}[1.25]{\includegraphics[angle=0,width=60mm]{figures/005_distplot}}](img28.png)
|
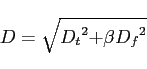
Density based clustering [23] facilitates searches for signals of unknown shape. It does not clutter the output with a list of numerous noise related clusters that contain just a few significant data-points. The algorithm looks for neighbors of those points that have at least a given number of neighboring points within a given distance on the time-frequency plane, and forms clusters of data-points that can be related through their common neighbors. Our implementation of density based clustering algorithm takes two parameters: minimum neighbor number and neighborhood radius, and it considers each tile produced by QPipeline as a data-point.
Density based clustering first finds a tile's nearest neighbors, then that neighbors' neighbors, and so on. In the left panel of Fig. 3, (a) shows data points before clustering. If the density of data points within a given distance around a point is above a given threshold to form a cluster, that point becomes a cluster seed (b). Neighboring data points having a sufficient number of neighbors are then included in the cluster (c). This process repeats as long as data points with sufficient number of neighbors are found (d).
Any clustering algorithm requires measurement of the pairwise
distances between all data points; in our case, the pairwise distance
between all tiles produced by QPipeline. Unfortunately, the tiles
have varied shapes, which makes measurement of distance between any
pair of tiles somewhat difficult. We have implemented a simple
distance metric that addresses the issue of varied tile shapes. For a
pair of tiles with center times ![]() and
and ![]() , center frequencies
, center frequencies
![]() and
and ![]() , Q of
, Q of ![]() and
and ![]() , and normalized energy of
, and normalized energy of ![]() and
and ![]() , the distance on the time-frequency plane D is measured from
the following relations:
, the distance on the time-frequency plane D is measured from
the following relations:
The mismatch metric in Equation 2 can also be used [10] for this purpose. However, in this initial study we have chosen to use the simpler approach of Equations 4, 5, and 6, and leave the possibility of using Equation 2 for future study.
The minimum neighbor number determines which tiles are to be considered as potential cluster seeds, and which ones are to be excluded from the clustering process entirely because they do not have a sufficient number of neighboring tiles. A minimum neighbor number that is too low may result in too many clustering seeds, potentially producing a large number of clusters, whereas a minimum neighbor number that is too high may result in the exclusion of too many tiles.
The neighborhood radius indicates the distance the algorithm searches from a tile in order to find neighboring tiles, and therefore determines the maximum gap over which the algorithm can cluster. A neighborhood radius that is too low may result in a large number of small clusters, whereas a neighborhood radius that is too high may result in the creation of one large cluster consisting of all significant tiles.
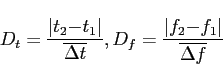
The exact numerical value of the neighborhood radius depends on the minimum neighbor number and the distance metric used. We have experimented by varying the minimum neighbor number from 1 to 8, and found that the best results were achieved with a minimum neighbor number of 4, as measured by the ROC curves in Section 5. The value of the neighborhood radius was then determined using the 4-distance graph in right panel of Figure 3. The 4-distance graph shows the number of tiles on the x-axis whose fourth closest neighbor is less than the distance shown on the y-axis. Motivated by the 4-distance plot, we experimented by varying the neighborhood radius between 3 and 12, and found that a value of 8 produced the best results based on the ROC curves in Section 5.
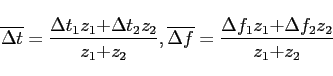
A flowchart of the density based clustering algorithm is shown in
Figure 4. The main clustering
function first uses the distance function to measure pairwise distance
between all tiles, and then calls the expandCluster function, which
recursively calls itself, to incorporate more tiles into the each
cluster. The algorithm as presented here was implemented in
MATLAB ![]() .
.
Clustering starts with the highest energy tile that has a sufficient number of neighbors, and then proceeds to the next significant tile that also has a sufficient number of neighboers, and is not already assigned to a cluster. If any qualifying member of the current cluster is found to be already belong to another cluster, the two clusters are merged. Thus, regardless of which tile the algorithm starts clustering from, it will always find the same clusters for a given set of tiles. For speed optimization, though, our density based clustering function starts with the more significant tiles first.
The computational cost of the resulting algorithm is dominated by the
![]() cost of computing the distance between all pairs of tiles, where
cost of computing the distance between all pairs of tiles, where
![]() is the number of tiles. In practice, clustering is applied
separately to the
is the number of tiles. In practice, clustering is applied
separately to the ![]() 1 minute data blocks used by the QPipeline
analysis. This is more than sufficient to detect clusters up to a few
seconds in duration, the typical limit of gravitational wave burst
searches. At the typical
1 minute data blocks used by the QPipeline
analysis. This is more than sufficient to detect clusters up to a few
seconds in duration, the typical limit of gravitational wave burst
searches. At the typical ![]() 1 Hz single detector false rate, the
resulting computational cost due to clustering is small compared to
that of the rest of the search.
1 Hz single detector false rate, the
resulting computational cost due to clustering is small compared to
that of the rest of the search.
The right panel of Fig. 2 shows an example cluster constructed using the proposed density based clustering algorithm. It can be seen that the algorithm has clustered together the most significant part of the previously discussed injection successfully. In addition, almost all of the spurious noise tiles have also been removed. While the high-frequency end of the signal has been lost, that part contains very little energy, and does not significantly contribute to the significance of the detected trigger.
![\includegraphics[angle=0,width=140mm]{figures/flowchart}](img52.png)