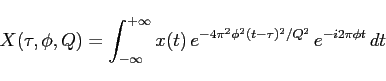
The QPipeline is an analysis pipeline for the detection of GWBs in
data from interferometric gravitational wave
detectors [10]. It is based on the
Q-transform [12], a multi-resolution time-frequency
transform that projects the data under test onto the space of Gaussian
windowed complex exponentials characterized by a center time ![]() ,
center frequency
,
center frequency ![]() , and quality factor
, and quality factor ![]() .
.
The space of Gaussian enveloped complex exponentials is an overlapping
basis of waveforms, whose duration ![]() and bandwidth
and bandwidth
![]() , defined as the standard deviation of the squared Gaussian
envelope in time and frequency, have the minimum possible
time-frequency uncertainty,
, defined as the standard deviation of the squared Gaussian
envelope in time and frequency, have the minimum possible
time-frequency uncertainty,
![]() , where
, where
![]() .
.
There is good reason to select an overlapping basis of multi-resolution minimum-uncertainty functions. Absent detailed knowledge of the gravitational waveform, such a basis provides the tightest possible constraints on the time-frequency area of unmodeled signals, permitting the time-frequency distribution of signal energy to be non-coherently reconstructed while incorporating as little noise energy as possible. A choice of basis that does not have minimum time-frequency uncertainty would typically include more noise than necessary, decreasing signal to noise ratio. The exception would be a restricted search for a known set of waveforms, in which a matched filter search, where the template matches the target signal, would be optimal. This type of restricted search is not the focus of this paper. Another benefit of the tighter time-frequency constraints afforded by a multi-resolution sine-Gaussian template bank is the decreased likelihood for false coincidences, when testing for coincidence between multiple detectors.
In practice, the Q transform is evaluated only for a finite number of
basis functions, also referred to here as templates or tiles. These
templates are selected to cover a targeted region of signal space, and
are spaced such that the fractional signal energy loss ![]() due to the mismatch
due to the mismatch ![]() ,
, ![]() , and
, and ![]() between an arbitrary basis function and the nearest measurement
template,
between an arbitrary basis function and the nearest measurement
template,
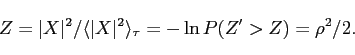
The statistical significance of Q transform projections are given by
their normalized energy ![]() , defined as the ratio of squared
projection magnitude to the mean squared projection magnitude of other
templates with the same central frequency and
, defined as the ratio of squared
projection magnitude to the mean squared projection magnitude of other
templates with the same central frequency and ![]() . For the case of
ideal white noise,
. For the case of
ideal white noise, ![]() is exponentially distributed, and related to
the matched filter SNR
is exponentially distributed, and related to
the matched filter SNR ![]() [13] by the
relation
[13] by the
relation
 |
(3) |
The QPipeline consists of the following steps. The data is first whitened by zero-phase linear predictive filtering [14,10]. Next, the Q-transform is applied to the whitened data, and normalized energies are computed for each measurement template. Templates with statistically significant signal content are then identified by applying a threshold on the normalized energy. Finally, since a single event may potentially produce multiple overlapping triggers due to the overlap between measurement templates, only the most significant of overlapping templates are reported as triggers. As a result, the QPipeline is effectively a templated matched filter search [13] for signals that are Gaussian enveloped sinusoids in the whitened signal space.
![\scalebox{1.0}[1.45]{\includegraphics[angle=0,width=75mm]{figures/001_injection}}](img20.png)
![\scalebox{1.0}[1.45]{\includegraphics[angle=0,width=75mm]{figures/002_tiles}}](img21.png)
|
Figure 1 shows an example of the QPipeline applied to the inspiral phase of a simulated binary neutron star coalescence signal injected into typical single detector LIGO data with an SNR of 48.2.