

This website is kept for archival purposes only and is no longer updated.
GALEX Frequently Asked Questions
Guest Investigator Program
2. What is the
schedule for the GALEX Guest Investigator program?
3.
Where do I get more information? Can I reach a person to answer
GALEX questions?
Mission
2. How can I reach
a person to answer GALEX questions?
3.
Why does GALEX observe only at night, whereas FUSE observes in all
parts of the orbit?
4. How long is an
orbit? How long is an eclipse? How long is an observation?
5.
What is the schedule for the GALEX mission?
Instrument and Operations
1.
Why can't GALEX observe bright stars? What are the brightness limits?
2. Why didn't GALEX
use big CCDs?
3. What is the
spectral response and dispersion of the GALEX grism mode?
4.
What is the spectral response of the GALEX FUV and NUV bands?
5.
Can GALEX observe moving targets?
6. What is
linearity range of count rates?
Has linearity been tested?
7. Why does the psf
vary across the image, and from image to image?
8. Is the psf variable as a function of counts (non
linear)
9.
Why are there "notches" and "scallops" in the images?
- What observation modes does
GALEX use?
- Can I pick the orientation(s) of the Grism?
Pipeline processing and calibration
1. What does the
GALEX data pipeline do?
2.
How was the data flat fielded? Background subtracted?
3.
How is GALEX data calibrated?
4. Will there be
improved processing? When will it
be available?
Data products
3.
How is GALEX data distributed?
5.
Can we use the ERO data for publications?
- Where can I get GALEX ERO data?
- What are the sensitivity
limits, completeness, and reliability vs. exposure time and background
level for the GALEX ERO catalogs?
Data interpretation
1. How do I
distinguish real sources from artifacts?
- Why are there "notches"
and "scallops" in the images?DI_2
- I see halos
around bright stars. What are
they? Do only bright stars
have these?
- What do GALEX magnitudes
mean?
- What do the
magnitude errors mean?
- What are
the dominant sources of background in the images?
7.
Why does the psf vary across the image, and from image to image?
8. Is the psf variable as a function of counts (non
linear)
9. Is the
astrometric calibration the same quality from image to image?
10. What is a
gnomonic projection?
- What is an image strip?
- How do I
plot GALEX detections over an image from another survey?
- How do I
extract columns of interest from a binary FITS table?
Answers
1.
Where can I find information
about the GALEX Guest Investigator program?
2.
What is
the schedule for the GALEX mission and Guest Investigator program?
The GALEX primary mission started normal operations in
July 2003 and will take at least 28 months to complete. A NASA Research Announcement released
in late January 2004, solicits Guest Investigator proposals to use the GALEX
observatory and archival data; proposals for Cycle 1 are due on 16 April 2004
and future cycles are expected to follow approximately the same cycle. GI observations will begin in late
2004. Further information
can be found at http://galexgi.gsfc.nasa.gov/.
3.
How can I reach a person to
answer GALEX questions?
Visit the GALEX Guest Investigator program web site
at http://GALEXgi.gsfc.nasa.gov or
contact the GALEX GI
helpdesk (Feb 1 to April 16 2004) or call 301-286-3623.
For technical or scientific questions, contact the help desk or GALEX
Mission Scientist, Dr.
Susan Neff (at GSFC, 301- 286-5137). For programmatic questions, contact the
GALEX Program Scientist, Dr. Zlatan
Tsvetanov (at NASA/HQ, 202-358-0810).
4.
The
GALEX
team has reserved all the targets of interest to me can I still propose to
the GI program?
Because
the GALEX Field-of-view is so large (1.2o), many targets of interest to different audiences may be
in the same field. You may propose
for a Guest Investigation as long as the science you are proposing does not
overlap any of the GALEX Science Team's primary science investigations (http://galexgi.gsfc.nasa.gov/piscience). If there is any appearance of
duplication, you will need to explain carefully (feasibility section in your
proposal) why your proposed investigation does not duplicate the science objectives
of the PI team. You may not need
to obtain new observations; you may be able to use the data that will be
released in Data Release 1
(DR1) for an Archival Proposal.
Mission
1.
Where is a web site with more
information on GALEX so friends or colleagues can learn about GALEX?
http://www.galex.caltech.edu or http://GALEXgi.gsfc.nasa.gov/
.
2.
How can I reach a person to
answer GALEX questions?
Visit the GALEX Guest Investigator program web site
at http://GALEXgi.gsfc.nasa.gov or
contact the GALEX GI
helpdesk (Feb 1 to April 16 2004) or call 301-286-3623.
For technical or scientific questions, contact the help desk or GALEX
Mission Scientist, Dr.
Susan Neff (at GSFC, 301- 286-5137). For programmatic questions, contact the
GALEX Program Scientist, Dr. Zlatan
Tsvetanov (at NASA/HQ, 202-358-0810).
3.
Why does GALEX observe only
at night, whereas FUSE observes in all parts of the orbit?
GALEX can only
observe when it is in the earth's shadow, or eclipse, because on the day side
of the orbit atmospherically-scattered sunlight and airglow would swamp and
might damage the detectors (especially the NUV detector). The GALEX field of
view is 1.25 degrees in diameter. Even the small amount of residual atmosphere
at the 700-km GALEX orbital altitude scatters significant flux into the telescope.
FUSE, (the Far Ultraviolet Spectroscopic Explorer) also has to contend with
atmospherically-scattered sunlight and airglow, but its field of view covers
about 100,000 times less sky, so much less of the scattered light enters the
spectrograph. There are other details in the way the two instruments operate
that make GALEX more susceptible to atmospherically-scattered sunlight
background. These include their wavelengths. FUSE operates at 905-1195
Angstroms. GALEX operates at 1350-2800 Angstroms, closer to the peak of the
sun's illumination. Also, during data reduction is not possible to remove
atmospheric lines from the slitless spectroscopy GALEX uses, in contrast to the
slit spectroscopy of FUSE.
4.
How
long
is an orbit? How long is an eclipse? How long is an observations?
GALEX orbits the earth every 98.6 minutes. Approximately
1/3 of this time is spent in eclipse, defined as the sun being below the
depressed horizon. The actual time available for an eclipse observation is
less, and is determined by a combination of observational constraints
(sun-angle, zenith-angle, location of SAA, moon-angle) and the observation
initiation sequence, which starts with a slew from solar pointing solar arrays
to the final target pointing and roll angle (twist). During this time the high
voltage is ramped from the intermediate value to nominal levels (which takes 2
minutes). Ramping can only start after the satellite enters the umbra.
5.
What is the schedule for the
GALEX mission and Guest Investigator program?
The GALEX primary mission started normal operations in
July 2003 and will take at least 28 months to complete. A NASA Research Announcement released
in late January 2004, solicits Guest Investigator proposals to use the GALEX
observatory and archival data; proposals for Cycle 1 are on 16 April 2004 and
future cycles are expected to follow the same cycle. GI observations are expected to begin in late 2004. Further information can be found
at http://galexgi.gsfc.nasa.gov/.
Instrument
and Operations
1.
Why can't GALEX observe bright stars? What are the brightness limits?
Fundamental
detector safety requirements
limit observations of bright targets.
Currently, point sources, with flat spectra, may not be observed (imaging
or grism) that are brighter than:
mAB
= 9.5 or Fn = 0.6 Jy or Fl = 7 x 10-12 erg cm-2
s-1 Å-1 in
the FUV;
mAB
= 10.8 or Fn = 0.2 Jy or Fl = 1 x 10-12
erg cm-2 s-1 Å-1 in the NUV.
Bright
and / or crowded fields may not be observed if they exceed total brightness
levels of :
(65000
counts / sec) =
Fn
= 7.8 Jy or Fl = 9 x 10-11 erg cm-2
s-1 Å-1 in
the FUV;
Fn
= 2.6 Jy or Fl = 1.5 x 10⁻¹¹
erg cm-2 s-1 Å-1 in the NUV.
Pointing
centers must be separated from bright stars by :
0.75o for an object with Fl = 1 x 10-12
erg cm-2 s-1 Å-1, or mAB
= 10.8 (NUV, ~ 2300 Å
) (5000cts/s)
0.88o for an object with Fl = 1 x 10-11
erg cm-2 s-1 Å-1, or mAB = 8.3
(50,000cts/s)
1.00o for an object with Fl = 4 x 10-11
erg cm-2 s-1 Å-1, or mAB
= 6.8
(200,000cts/s)
1.50o for an object with Fl = 1 x 10⁻¹⁰
erg cm-2 s-1 Å-1, or mAB
= 5.8
(500,000cts/s)
2.00o for an object with Fl = 2 x 10⁻¹⁰
erg cm-2 s-1 Å-1, or mAB
= 5.0
(1,000,000cts/s)
More
information may be found in the GALEX detector guide (http://galexgi.gsfc.nasa.gov/Documents).
2. Why didn't GALEX use big
CCDs?
The microchannel-plate (MCP) detectors that GALEX uses have
intrinsically low red leak so they reject longer-wavelength light that is
outside the nominal bandpass. This is important in the ultraviolet since the
sky is much brighter in the visible (redward) than in the UV. To avoid red
leaks, CCDs require special filters that are difficult to make and prone to
pinholes. In addition, CCDs require cooling, which greatly exacerbates the
difficult contamination control necessary for ultraviolet instruments. Next,
MCP detectors detect and time tag each photon. This permitted us to save in
development cost by using looser satellite pointing requirements and
reconstructing the image using software after the data is telemetered to the
ground. Were data taken on a CCD detector with the same satellite pointing, the
image would be blurred. Finally, the GALEX detector active area is 65 mm in
diameter, ideal for this survey mission. CCDs are available in neither the
requisite size nor shape, and CCD mosaics have gaps.
3.
What are the spectral responses of the GALEX FUV and NUV
bands?
See
Section
3 of the GALEX Observer's Guide.
4 What is the spectral response
and dispersion of the GALEX grism mode?
GALEX has a peak spectral response (effective area) of
approximately 22 cm2 in the FUV and 49 cm2 in the NUV. The mean response in the
FUV between 1350 and 1800 Angstroms is 13 cm2. The mean response in
the NUV between 1800 and 2800 Angstroms is 35 cm2. Plots of the
response of the most significant spectral orders in each band are shown.
The mean dispersion for the FUV in 2nd order is 1.6
Angstroms per arcsecond (range 1.2 to 1.9). The mean dispersion for the NUV in
1st order is 4.0 Angstroms per arcsecond (range 3.3 to 4.3). With a 5 arcsecond FWHM PSF, a point
source would yield a FWHM resolution of approximately 8 Angstroms in FUV, and
20 Angstroms in NUV. A plot of the dispersion function for the most significant
orders are shown. Note that, in
direct image mode, the source would appear at approximately the position of
offset=0 in grism mode.


5.
Can GALEX observe moving
targets?
This is not a supported GALEX observation mode. Since GALEX counts individual photons,
a moving target may be allowed to drift across the field, and the image may be
reconstructed using the time-tag photon list. Guest investigators wishing to observe moving targets will
be given time-tag data and will be responsible for reconstructing the images
themselves.
6.
What
is
linearity range of count rates?
Has linearity been tested?
The GALEX detectors have a non-linear response at high
count rates due to both local effects attributable to the intensifiers and
global effects due to the electronics.
The global effects are corrected in the pipeline, and amount to a
correction as high as 40% for the highest allowable global rates (100,000
cps). The local linear range of
count rates has also been tested on the ground for the two detectors. We found that for isolated stars, the
FUV detector is linear to about 100 cps (m~14) and the NUV detector is linear
to about 1000 cps (m~12.5). This
difference is attributable to the proximity focus method of the NUV detector,
which spreads the PSF out over a larger area on the intensifier surface, reducing
the current density. We now have a
wealth of flight data and are using it to refine the linearity calibration
across each detector field of view.
7.
Why does the psf vary across
the image, and from image to image?
The
point spread function or psf is determined by the microchannel plate detector
PSF, as well as the GALEX (Ritchey-Chrétien) optical design and the as-built
tolerance errors. The detector psf is determined by the position digitization
process, which is analog and subject to random noise. The psf varies across the
image due primarily to gain variations (lower gain regions having a broader
psf). Other effects that affect the wings of the psf include surface roughness
of the optical surfaces, ghosts from multiple reflections in refractive optical
elements, and grazing reflections from baffles or struts in the optical beam
path. Most optical design aberrations cause the psf to vary radially over the
field of view, but those associated with the dichroic beamsplitter cause
variation along the satellite X-axis, which can vary in sky coordinates,
depending on the satellite orientation around the telescope optical axis. Thus,
in general a given source in a repeated observation of the same part of the sky
will have a different psf if the satellite orientation is different around the
telescope optical axis.
8.
Is
the
psf variable as a function of counts (non linear)?
Yes, the PSF will change under intense illumination as
the intensifiers exhibit a phenomenon known as "gain sag" whereby the
central region of bright star images will be flattened and then eventually
cored out as the intensity of the star increases.
9.
Why are there notches and
scallops in the images?
There is a notch in FUV images due to a high detector
background emission "plume" at one edge of the detector. Depending on the roll
angle a target is observed, it may appear anywhere on the perimeter. The FUV detector also displays some
areas of low gain and efficiency. The pipeline masks images in regions were the
relative efficiency falls below 0.2, which produces the FUV scallop. A more detailed discussion of image artifacts may be found in Section
7 of the GALEX
Pipeline Data Guide.
10. What observation modes does GALEX
have?
All
science data collection uses a spiral dither, to prevent bright-star-induced
fatigue of localized regions on the detectors and to improve image
flat-fielding. In "single-visit"
or "stare/dither" mode, only one field center is observed for an entire
eclipse. In "sub-visit observations", or "AIS
(All-sky Imaging Survey) mode", several (typically 10-12) contiguous field
centers are observed during one orbital night. Grism observations are always done in "single visit" mode;
multiple observations are made at different grism orientations and then
combined. GI observations may only
use these standard GALEX observing modes.
11. Can I pick the orientation(s) of the grism?
Yes. The grism has 872 possible grism angles selectable. In the target list you should specify
the PA on the sky along which you would like the dispersion to run. If you wish to do spectroscopy in
crowded fields, using more than about 6 grism exposures, then it is advisable
to let the planning software choose random grism angles (to improve observing
efficiency).
Pipeline Processing and Calibration
1.
What does the GALEX data
pipeline do?
A
detailed discussion may be found in the GALEX
Pipeline Data Guide, but in short, the pipeline converts GALEX photon
lists, satellite telemetry data and any necessary corollary data into
calibrated images and catalogs. The GALEX Science Operations Center (SOC)
receives data from the satellite and unpacks it into time-tagged photon lists,
instrument/SC housekeeping and satellite aspect information, and uses it to
generate images, spectra and source catalogs. An astrometric module corrects the photon positions for
detector and optical distortions and determines an aspect solution using star
positions from the time-tagged photon data, a photometric module accumulates
the photons into count and intensity maps and extracts sources from images, and
(for grism observations) a spectroscopic module uses image source catalog
inputs to extract spectra of individual sources from the multiple slitless
grism images.
2.
How are the data flat
fielded? Background
subtracted? Will there be improved
processing?
The data are initially being flat-fielded using ground
measurements of the system throughput, and this yields relative photometry on
the order of 25% repeatability.
Work is currently being done to refine the flat field based on much
higher resolution flight data, and we expect this to improve the relative
photometry substantially. The Early Release Observations use ground-based
corrections. The first major data release
(DR1) will have improved processing.
- How is GALEX data calibrated?
Details of GALEX calibration may
be found in the GALEX
In-Flight Calibration Plan.
Calibration steps are summarized below. The initial calibration was done on the ground, before
flight. Data acquired in-flight
are being used to improve and refine calibration parameters. The ERO
data were calibrated using the pre-flight ground calibration. DR1 will be calibrated with
in-flight parameters.
Ground calibration:
Galex was calibrated on the
ground during the spring of 2002, in thermal vacuum, using a Roper Scientific
Acton Research VM-502 0.2-m vacuum monochromator with a deuterium lamp to
provid UV illumination. Top
priority calibration items were relative sensitivity versus wavelength, flat
field, imaging-to-spectroscopic differential sensitivity versus wavelength, and
spatial nonlinearity. Middle priority were absolute sensitivity (measured at 3
pencil beam locations in the aperture), grism dispersion function compared to
imaging, high count rate tests (local and global), and a sky-simulation target.
Lowest priority were PSF characterization, near-angle stray light, deuterium
spectrum (monochromator at zero order), and detector background. Results of this calibration may be
found in the GALEX
Observer's Guide.
In-flight
calibration:
The
GALEX In-Flight
Calibration Plan gives extensive details. The in-flight calibration procedure and some results
were presented at the Atlanta AAS meeting (96.02 [secure site]On-Orbit
Performance of the Galaxy Evolution Explorer (GALEX) P. Morrissey (CalTech), GALEX
Science Team ), summarized here as follows:
·
Several
"calibrator" fields containing well-known stars (eg LDS749b) will be observed
in different GALEX field locations to refine absolute calibration
·
Relative
calibration will be obtained with multiple observations of rich fields.
·
Numerous
detector corrections (wiggle, walk, distortion, flat field, ACS dither) will be
refined with in-flight data
·
Initial
indications are that GALEX throughput is close to the value measured in ground
calibration: NUV zero ~ M20, FUV zero ~M19.
·
Current
photometry accuracy is +/- 0.10Mab FUV, +/-0.05Mab NUV. Goal is +/-0.05 both channels
·
Ground
and Flight PSF measurements are in excellent agreement:
FUV:
~5" FWHM
NUV:
~6" FWHM
·
Pipeline
PSF performance is now approaching optimal values with the recent addition of a
global detector "wiggle" correction.
·
Detector
flight background count rates are comparable to ground measurements, with total
backgrounds of 76 counts/sec (FUV) and 189 counts/sec (NUV). These may be compared to typical global
flight count rates of ~3000cps FUV
and ~20000 cps NUV
·
GALEX
flat fields are being refined using sky background data; this is likely to
improve photometric repeatability at the finest levels
·
Astrometric
performance is +/- 1.2" FUV, +/- 0.8" NUV; goal is +/- 0.5" both channels
·
Spatial
non-linearity currently limits resolution at the field edges, affecting
approximately the outermost 10' significantly. The non-linearity map will be
refined using star fields measured at different angles.
4.
When will improved calibration and processing be available?
The first
major data release (DR1) will be on 1 October 2004 and will have improved
processing.
Data Products
- What data products will GALEX distribute?
For
a single imaging target, the ERO data includes
· FUV and NUV intensity image (FITS), 3480 x 3480
pixels, 1.5" pixels, J2000 WCS, in counts
· Basic matched catalogue of extracted sources
(FITS and text); including matched
FUV+NUV sources, R.A., Dec., magnitudes and errors, fluxes and errors, EB-V,
sizes, and data flags.
· The full pipeline output is also available,
although most users will not want this
For
a single spectroscopy target, the ERO data includes:
· 1-D extracted combined spectra (FITS), 1300-3000
Å, in units of photons sec-1 cm-2 Å-1 vs. Å, on a linear dispersion scale; including a number of estimated source properties.
·
The full pipeline
output is also available, although, again, most users will not want this
DR1
will include all of the above, but calibration will be based on in-flight
calibrations, improved flat fields and artifact removal, measures, spectral
image strips will be included as images, and several additional fields will be
included in the source catalogues.
- What is the release schedule for GALEX
data?
Early
Release Observations (ERO) were released on 1 December 2003, and are available,
together with a query server and other tools for efficient data retrieval, at
the Multimission
Archive at Space Telescope (MAST),
Data Release 1, containing
~10% of each of the GALEX surveys, will be released on 1 October 2004
Data
Release 2, containing the rest of the GALEX survey data, is currently planned
for June 2006.
- How is GALEX data distributed?
All GALEX data
is distributed to the astronomical community through the GALEX archive within
the Multimission
Archive at Space Telescope (MAST), using protocols similar to
those used for distribution of HST data.
4.
How does the quality of the
ERO data compare to GALEX observations so far, and to the planned complete mission?
The ERO imaging data quality should be typical for GALEX
observations so far. The satellite
performance has been stable, and the pipeline has been revised twice to account
for on-orbit performance. We anticipate that further improvements in the
pipeline may improve the PSF and flat-field moderately, and may handle detector
artifacts more automatically. The catalogues are expected to improve
substantially in future data releases.
A principle deficiency in the early pipeline is the handling of the most
extended sources, which tend to be shredded by the detection algorithms. Faint
sources near the confusion limit will probably require refined processing to
achieve the theoretical sensitivity limits. In particular, the ERO
spectroscopic products (catalogues, extracted spectra) have received
substantially less attention than the images, and we expect significant
improvements in future releases.
5.
Can we use the ERO data for
publications?
The ERO data are
in the public domain. However, the principal goal of this release is to provide
potential Guest Investigators information about GALEX data properties. The lean
GALEX Science Operations and Data Analysis Team has concentrated the majority
of its resources in the early mission months on producing high quality images,
the fundamental input to downstream pipeline products. Catalog and
spectroscopic products have received less attention to date. Calibration
observations and analysis continue, but are not complete. The documentation
provided with the ERO data is limited.
Thus we caution that science analysis using the ERO data set may require
revision, possibly significant. The first major public data release (DR1, 1 October 2004) will
be of sufficient and known quality to support most science investigations.
- Where can I retrieve GALEX ERO
data?
Starting
January 15, 2004, the Multimission Archive
at Space Telescope (MAST) will have the ERO images and catalog data
on-line, with a query server and other tools for efficient data retrieval. ERO data may also be found at
www.galex.caltech.edu/EROWebSite/early_release_observations.htm.
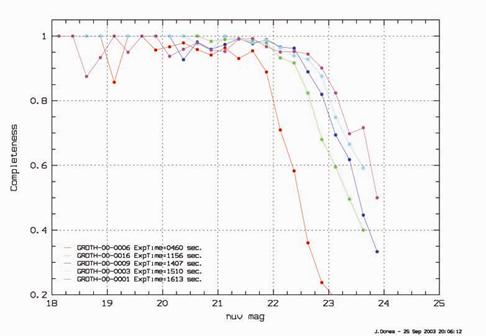
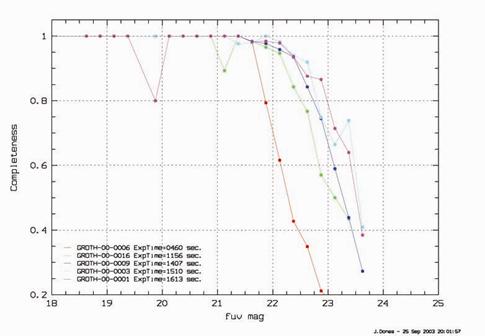
7. What are the sensitivity limits, completeness,
and reliability vs. exposure time and background level for the GALEX
ERO catalogs?
The
completeness and reliability of the GALEX catalogs are functions of the
sensitivity limit, the exposure time, and the background level. The local
source density is of course an additional important factor. The exact
relationships are still a topic of investigation by the GALEX Science
Team. Some estimates have been
established using the initial three months of survey data: completeness and
reliability have been investigated using multiple visits to the same fields,
using MIS and DIS observations of AIS fields, and by using artificial subvisits
created from MIS visits; reliability has been studied using combined FUV and
NUV catalogs, and by comparing GALEX with other catalogs such as SDSS.
The
following plots give preliminary
completeness results for exposure times of 400-1600 seconds in the relatively
low background Groth DIS region. NUV is left and FUV is right. All GALEX magnitudes are in the AB
system.
 |
|
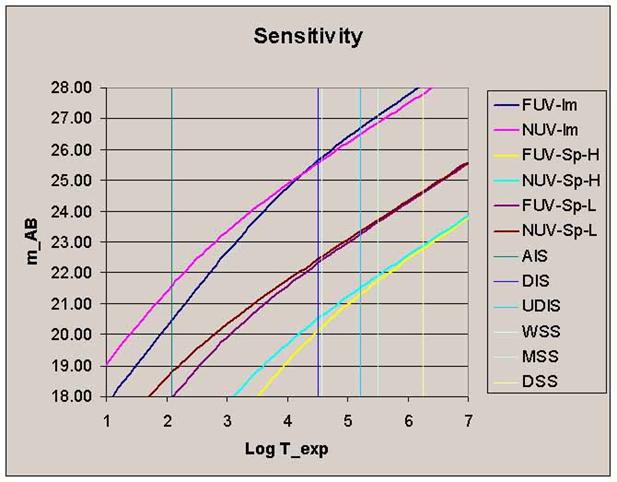
Sensitivity vs. exposure time for low background targets
(DIS, which have low diffuse galactic light and zodiacal background) is shown
in the Figure below. At these
background levels, imaging surveys are background limited for exposures longer
than 2 ksec [NUV] and 10 ksec [FUV] respectively. Background levels may be as high as 3-5 times these, with
corresponding reduction in the transitional exposure time.
Catalog reliability has been measured by comparing detected GALEX
sources with SDSS DR1 sources. GALEX sources without a SDSS DR1 within 6 arcsec
radius are considered spurious, and reliability is calculated as R=1-[#GALEX w/
NO SDSS]/[#GALEX]. Reliability of 90% is achieved in the AIS at mFUV~21
and mNUV~22. In the MIS, 90% occurs at mFUV~23.25 and mNUV~23.25.
A small fraction in the MIS NUV sources may indeed have missed detection by
SDSS, so this may be an underestimate of the MIS NUV reliability.
|
GALEX |
AIS [3 deg^2] |
MIS [1 deg^2] |
||||||
|
mag |
# |
Fraction spurious |
# |
Fraction spurious |
||||
|
m |
#FUV |
#NUV |
FUV |
NUV |
#FUV |
#NUV |
FUV |
NUV |
|
13.75 |
0 |
1 |
0 |
0 |
|
|
|
|
|
14.25 |
0 |
2 |
0 |
0 |
0 |
2 |
0 |
0 |
|
14.75 |
0 |
4 |
0 |
0 |
0 |
2 |
0 |
0 |
|
15.25 |
0 |
8 |
0 |
0 |
0 |
1 |
0 |
0 |
|
15.75 |
1 |
9 |
0 |
0 |
1 |
7 |
0 |
0 |
|
16.25 |
1 |
14 |
0 |
0 |
1 |
1 |
0 |
0 |
|
16.75 |
2 |
12 |
0 |
0 |
0 |
4 |
0 |
0 |
|
17.25 |
3 |
22 |
0 |
0 |
1 |
6 |
0 |
0 |
|
17.75 |
2 |
19 |
0 |
0 |
0 |
6 |
0 |
0 |
|
18.25 |
4 |
46 |
0 |
0.022 |
1 |
18 |
0 |
0 |
|
18.75 |
8 |
56 |
0 |
0 |
7 |
20 |
0 |
0 |
|
19.25 |
24 |
77 |
0 |
0 |
9 |
29 |
0 |
0 |
|
19.75 |
42 |
124 |
0.071 |
0.008 |
9 |
47 |
0 |
0 |
|
20.25 |
66 |
187 |
0.045 |
0.016 |
33 |
78 |
0 |
0 |
|
20.75 |
119 |
281 |
0.076 |
0.025 |
52 |
96 |
0.019 |
0.021 |
|
21.25 |
213 |
437 |
0.174 |
0.025 |
78 |
210 |
0.013 |
0.01 |
|
21.75 |
128 |
484 |
0.266 |
0.064 |
162 |
283 |
0.037 |
0.018 |
|
22.25 |
6 |
129 |
0.5 |
0.109 |
269 |
520 |
0.026 |
0.021 |
|
22.75 |
0 |
2 |
0 |
0.5 |
386 |
789 |
0.028 |
0.046 |
|
23.25 |
|
|
|
|
326 |
835 |
0.092 |
0.098 |
|
23.75 |
|
|
|
|
16 |
238 |
0.188 |
0.181 |
|
24.25 |
|
|
|
|
0 |
2 |
0 |
0 |
|
TOTAL |
619 |
1914 |
|
|
1009 |
2119 |
|
|
Data Interpretation
- How do I distinguish real sources from
artifacts?
Artifacts
are in general very distinguishable from real sources, notably with visual
inspection. A detailed discussion of
known artifacts, with examples, may be found in the GALEX Pipeline
Data Guide. Most artifacts are
associated with bright stars, and/or particular regions of the field of view,
and can therefore be anticipated and removed or ignored. The pipeline currently
recognizes and flags many, but not all artifacts. Many FUV artifacts are
apparently immediately from the lack of a corresponding NUV source, which
should be present in almost all cases when real FUV sources are detected.
2.
Why are there notches and scallops in the images?
There is a notch in FUV images due to a high detector
background emission "plume" at one edge of the detector. Depending on the roll
angle a target is observed, it may appear anywhere on the perimeter. The FUV detector also displays some
areas of low gain and efficiency. The pipeline masks images in regions were the
relative efficiency falls below 0.2, which produces the FUV scallop.
3.
I
see halos
around bright stars. Do only
bright stars have these?
All
sources have halos with amplitude proportional to the flux from the source. The
bright-source halos are just more obvious.
- What do GALEX magnitudes mean?
GALEX uses AB magnitudes (Oke
1990) which are defined as
mAB=-2.5
log10fn(erg cm-2s-1hz-1)
48.6.
GALEX
magnitudes convert to microJanskies using
log10
f[mJ] = -0.4m+9.56
The
following table gives conversions
from GALEX countrates to AB and other magnitudes.
|
Parameter |
Description |
FUV |
NUV |
Units |
|
|
effective wavelength |
1516 |
2267 |
Å |
|
|
Pivot wavelength |
1524 |
2297 |
Å |
|
|
Average wavelength |
1529 |
2312 |
Å |
|
|
rms bandwidth |
114 |
262 |
Å |
|
|
FWHM bandwidth |
269 |
616 |
Å |
|
|
effective bandwidth |
268 |
732 |
Å |
|
Uresp |
unit response (1 cps; mGALEX = 0) |
|
|
erg s-1 cm-2
Å-1 |
|
f0 |
fGALEX (1 cps; mGALEX = 0) |
108 |
36 |
[10-29erg s-1
cm-2 Hz-1] |
|
m0 (AB) |
mAB-mGALEX
|
18.82 |
20.02 |
magnitudes |
|
m0 (STLAM) |
mSTLAM-mGALEX |
16.04 |
18.12 |
magnitudes |
|
m0 (AB) m0
(STLAM) |
mAB-mSTLAM |
2.78 |
1.90 |
magnitudes |
- What do the magnitude errors mean?
Magnitude
errors are a determined by the Source Extraction (Sextractor) routine using
simply Poisson errors expected from the number of photons in the source and
background (i.e., errors do not include errors in the determination of the
background (which is based on a large-scale smoothed backround image) or on any
systematic component.
- What are the dominant sources of
background in the images?
In the FUV channel, diffuse galactic light (DGL)
from dust-scattered starlight dominates the background. DGL varies from 300 ph
cm-2s-1A-1sr-1 (PU) to > 2000
PU, depending largely on the dust column density (and to some extent on the
local stellar radiation field), which is well correlated with extinction and HI
column density. Some contribution to the FUV background comes from H2
fluorescence, HII 2-photon emission, and line emission from ionized gas in the
104-106 K interstellar medium. In the NUV channel, zodiacal light dominates the background,
with a substantial contribution from DGL as well. Detector background is very
low in comparison (<1%), except in local "hot spots" which are masked in
pipeline processing. Nightglow
from residual atmosphere at 700 km altitude produces a modest amount of
background in both channels, which increases at the beginning and ending of any
eclipse as the zenith angle increases (see eclipse profile in Section
2 of the GALEX Observer's Guide).
7.
Why does the psf vary
across the image, and from image to image?
The
point spread function (psf) is determined by the microchannel plate detector
PSF, as well as the GALEX (Ritchey-Chrétien) optical design and the as-built
tolerance errors. The detector psf is determined by the position digitization
process, which is analog and subject to random noise. The psf varies across the
image due primarily to gain variations (lower gain regions having a broader
psf). Other effects that affect the wings of the psf include surface roughness
of the optical surfaces, ghosts from multiple reflections in refractive optical
elements, and grazing reflections from baffles or struts in the optical beam
path. Most optical design aberrations cause the psf to vary radially over the
field of view, but those associated with the dichroic beamsplitter cause
variation along the satellite X-axis, which can vary in sky coordinates,
depending on the satellite orientation around the telescope optical axis. Thus,
in general a given source in a repeated observation of the same part of the sky
will have a different psf if the satellite orientation is different around the
telescope optical axis.
8.
Is
the psf variable as a function of counts (non
linear)?
Yes, the PSF will change under intense illumination as
the intensifiers exhibit a phenomenon known as "gain sag" whereby the
central region of bright star images will be flattened and then eventually
cored out as the intensity of the star increases.
9.
Is
the astrometric calibration the same quality from image to image?
The main limitation on the astrometric repeatability is
our knowledge of the fine-grained distortion map for each detector. As fields are observed at different
roll angles, errors in the distortion map, especially at the field edges, may
creep into the astrometric solution.
Flight data is currently being used to refine the ground-data-generated
distortion map, and several special observations may be planned for the purpose
of observing a large number of FUV stars in order to complete this task. Currently, the astrometric precision is
of order 1", but there may be isolated areas at the edge of the field
where the error is significantly larger.
More details are given in Section
6 of the GALEX Observer's Guide.
10.
What is a gnomonic
projection?
A gnomonic projection maps a sphere onto a plane by
projecting all points on the sphere radially, from the sphere's center, onto a
plane that is tangent to the sphere. This projection distorts both angle and
area, but it has the useful property that all great circles are projected into
straight lines. One can see this by noting that all great circles lie in planes
containing the center of the sphere, and that the projection will therefore be
the line of intersection between the plane containing the great circle and the
plane of the projected map. For more detail, see for instance: http://mathworld.wolfram.com/GnomonicProjection.html
11.
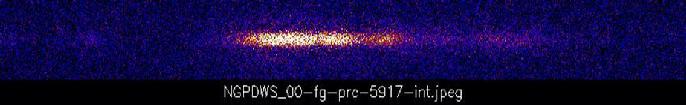
What is an image strip?
The GALEX spectroscopic mode employs slitless
spectroscopy. This provides an image of the sky in which every object is spread
out into a spectrum similar to what one sees when viewing the sky directly
through a prism or transmission grating. GALEX uses a transmission grism, a
ruled prism. This has the advantage of providing spectra for all the objects in
the large GALEX field of view but the disadvantage of overlapping spectra in
crowded fields. For this reason we take spectra of each part of the sky at
different spectral position angles on the sky. This permits us to remove the
confusion caused by overlapping spectra. An image strip is a two-dimensional
spectrum. As in slit spectroscopy, one dimension is the spectral dimension and
the other is the spatial dimension. In slitless spectroscopy however, the
spectral dimension is also a spatial dimension, thus a single point on a GALEX
grism-mode image represents various wavelengths depending on the source
position in the sky, along the spectral-dispersion dimension.
The image strip is a portion of the (corrected)
two-dimensional detector image (in grism mode) representing the locations where
photons from the spectrally-dispersed source reach the detector. The image
strip size is usually about 80 by 600 arcseconds (default scale is 1
arcsecond/pixel), but this size can vary depending on the source flux. The
image strip is long enough to include the primary grism orders (1,2 for NUV and
2,3 for FUV) and is wide enough to include all the background used for
background subtraction during spectral extraction. The source is centered on
the middle row of the image in the dimension orthogonal to the dispersion. The
blue end of the spectrum is to the left or lower column numbers. Multiple grism
orders may be present--usually 1st&2nd for NUV, and 2nd&3rd for FUV. An
image strip, as described above, contains photons from a single visit
during a single eclipse, at a single grism position angle. Image strips can
also contain photons from multiple visits at various positions angles, by
taking either a sum or a median at each pixel in the individual image strips.
The image values are scaled integers with the zero point and scale factor given
in the header for each source. Negative values in the image strips indicate
masked pixels which are ignored in the final spectral extraction.
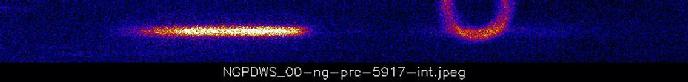
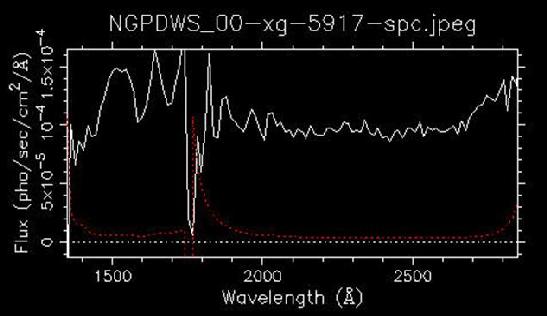
The following two images show image strips from a single
source (5917) from NUV (top) and FUV (bottom). The extracted spectrum is given
in the bottom panel. More
information on GALEX spectroscopic data processing may be found in Section 3 of
the GALEX
Pipeline Data Guide.
- How do I plot GALEX detections over an
image from another survey?
The
fastest way to do this is to use ds9, the image display program freely available from http://chandra-ed.harvard.edu/install.html
. Open the image of interest in ds9 (the image must have a J2000 WCS), then go
to Region (on main menu), Load
Regions, and find the ttttttt_vvvv-[f,n]d-cat.ds9reg
file. GALEX detection ellipses determined by the object size and position angle
will be displayed as green ellipses.
- How do I extract columns of interest from
a binary FITS table?
There
are various methods for extracting columnar data from binary fits tables. In
IDL, the mrdfits astro lib
function reads fits tables into structures with the appropriate tag names. fv
is a useful utility for viewing
fits tables and can be downloaded here.
Responsible NASA Official:
Curator: