Pre-print draft: arXiv:1407.7530
Journal: The The Astrophysical Journal, Volume 799, Issue 2
Finding η Car Analogs in Nearby Galaxies Using Spitzer:
II. Identification of An Emerging Class of Extragalactic Self-Obscured Stars
Rubab Khan, K. Z. Stanek, C. S. Kochanek, J. Gerke
Abstract:
Understanding
the late-stage evolution of the most massive stars such as η Carinae is
challenging because no true analogs of η Car have been clearly
identified in the Milky Way or other galaxies. In Khan et al. (2013),
we utilized Spitzer IRAC images of 7 nearby (<~4Mpc) galaxies to
search for such analogs, and found 34 candidates with flat or red
mid-IR spectral energy distributions. Here, in Paper II, we present our
characterization of these candidates using multi-wavelength data from
the optical through the far-IR. Our search detected no true analogs of
η Car, which implies an eruption rate that is a fraction 0.01 <~ F
<~ 0.19 of the ccSN rate. This is roughly consistent with each MZAMS
> 70M_⊙ star undergoing 1 or 2 outbursts in its lifetime. However,
we do identify a significant population of 18 lower luminosity
(log(L/L_⊙) ≃ 5.5 − 6.0) dusty stars. Stars enter this phase at a rate
that is fraction 0.09 <~ F <~ 0.55 of the ccSN rate, and this is
consistent with all 25 < MZAMS < 60M⊙ stars undergoing an
obscured phase at most lasting a few thousand years once or twice.
These phases constitute a negligible fraction of post-main sequence
lifetimes of massive stars, which implies that these events are likely
to be associated with special periods in the evolution of the stars.
The mass of the obscuring material is of order ∼ M⊙, and we simply do
not find enough heavily obscured stars for theses phases to represent
more than a modest fraction (∼ 10% not ∼ 50%) of the total mass lost by
these stars. In the long term, the sources that we identified will be
prime candidates for detailed physical analysis with JWST.
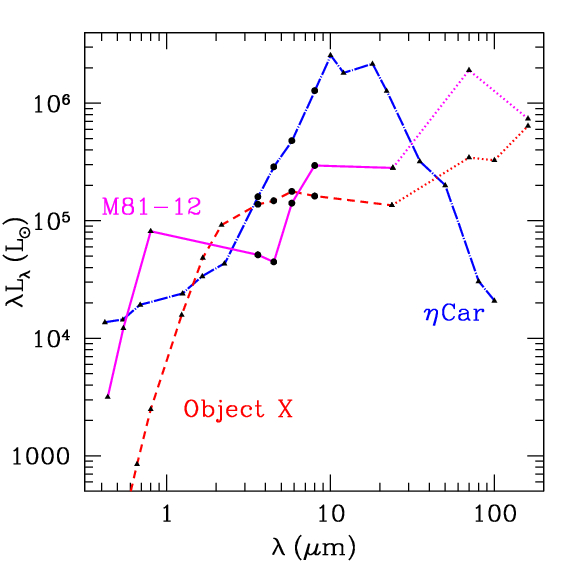
Fig.
1.— The spectral energy distributions (SEDs) of the dust-obscured
massive star η Car (dashdot line, e.g., Robinson et al. 1973; Humphreys
& Davidson 1994), “ObjectX” in M33 (dashed line; Khan et al. 2011),
and an obscured star in M81 that we identify in this paper (M81-12,
solid line). All these stars have SEDs that are flat or rising in the
Spitzer IRAC 3.6, 4.5, 5.8 and 8.0 μm bands (marked here by solid
circles). The three shortest wavelength data-points of the M81-12 SED
are from HST BV I images. The 24 μm measurements of both ObjectX and
M81-12 are from Spitzer MIPS while the dotted segments of their SEDs
show the Herschel PACS 70, 100, and 160 μm upper limits.
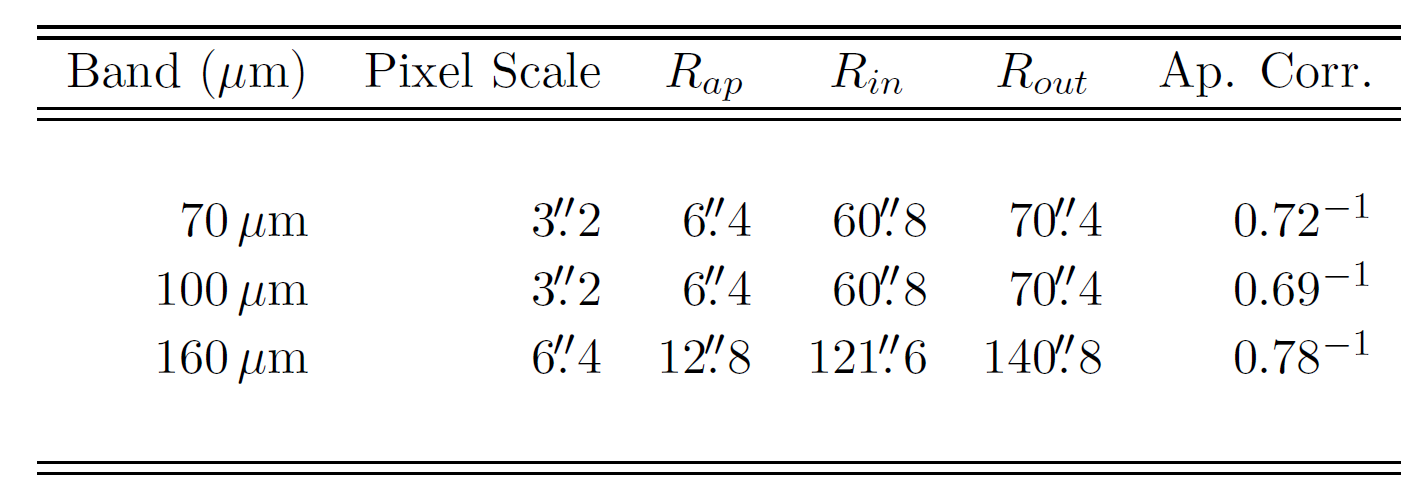
Table
1 — The
PACS Aperture Definitions. We used the Herschel PACS (Poglitsch et al.
2010) 70, 100, and 160μm images available from the public Herschel
Science Archive. Although both MIPS and PACS cover the same far-IR
wavelength range (70 − 160μm), Herschel has significantly higher
resolution (see Figures 2 and 3). All three PACS band data were
available for M33 and NGC7793, 70 and 160μm data were available for
NGC2403 and M81, and 100 and 160μm data were available for NGC300.
There are no publicly available PACS images of the candidates in
NGC247. We used aperture photometry (IRAF4 ApPhot/Phot) with the extraction apertures and aperture corrections from Balog et al. (2013). We treat the measurements obtained in the PACS bands as upper limits because the spatial resolution of these bands requires increasingly large apertures at longer wavelengths.
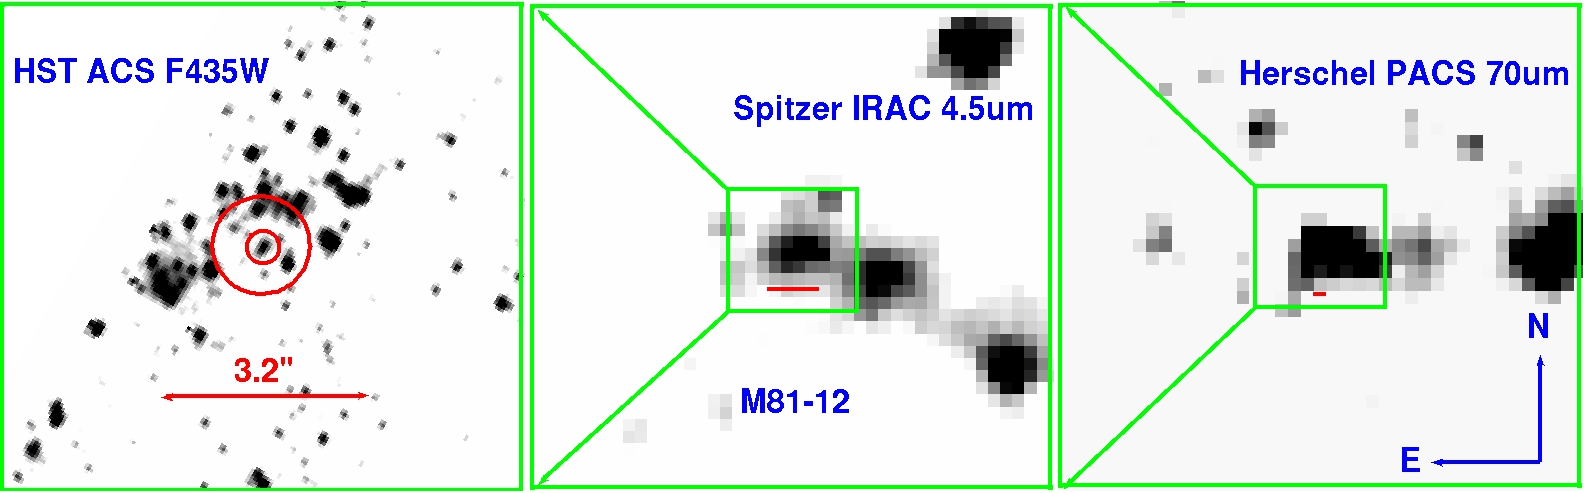
Fig.
2. — The Hubble, Spitzer, and Herschel images of the region around M81-12. In the left panel, the radii of the circles are 0.′′25 (5 ACS pixels) and 1.′′43 (IRAC 4.5 μm PSF FWHM), and the source at the position of the smaller circle in the left panel is the brightest red point source on the CMD (Figure 4, left panel). The red line in each panel is the size of a PACS pixel (3.′′2).
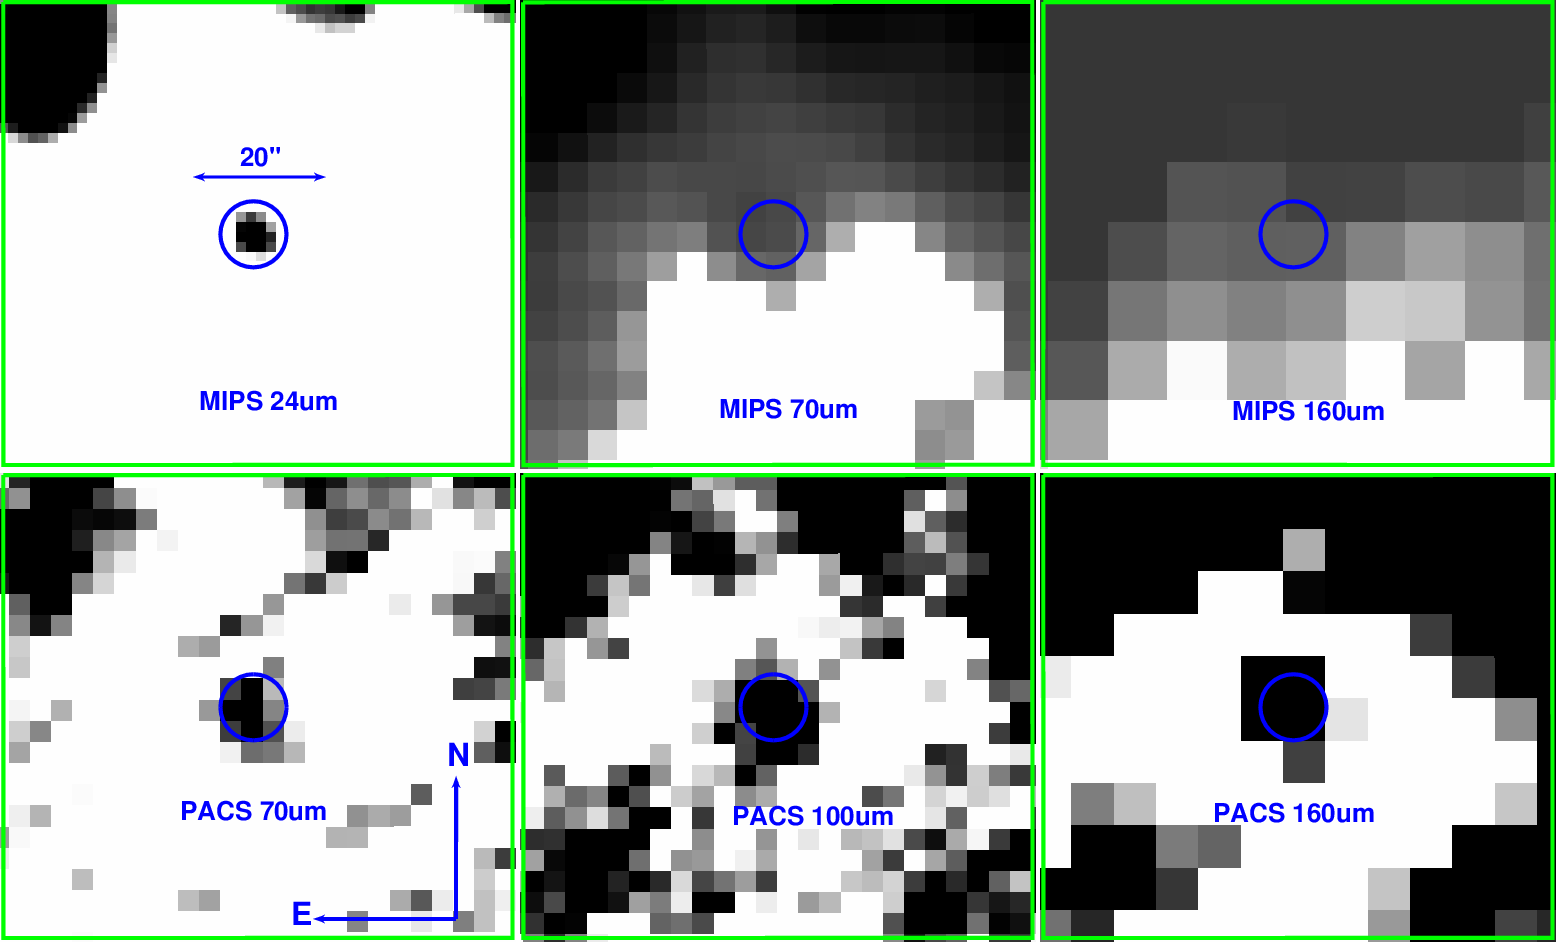
Fig.
3.— The Spitzer MIPS 24, 70 and 160 μm (top row) and Herschel PACS 70,
100 and 160 μm (bottom row) images of the region around the object
N7793-9. The higher resolution of the PACS images helps us set tighter limits on the far-IR emission from the candidates.
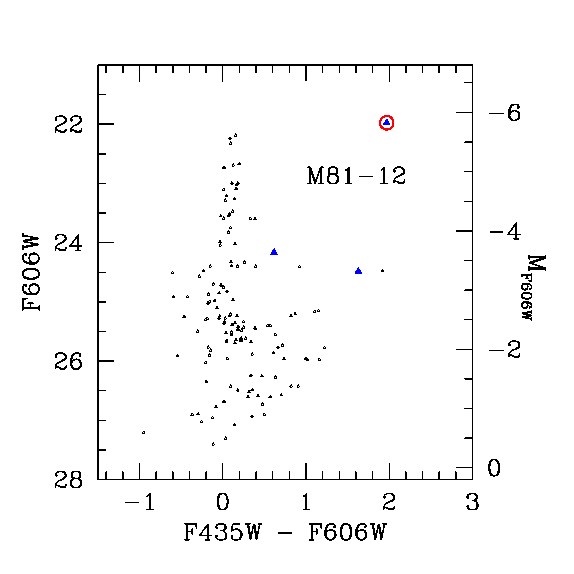
Fig.
4.— EThe F606W (V ) vs. F435W − F606W (B −V ) color magnitude
diagram (CMD) for all HST point sources around M81-12. The three large
solid triangles denote sources located with the 0.′′3 matching radius.
The small open triangles show all other sources within a larger 2.′′0
radius to emphasize the absence of any other remarkable sources nearby.
The circle marks the source at the position of the smaller circle in
the left panel of Figure 2, which is the brightest red point source on
the CMD. The excellent (< 0.′′1) astrometric match and the prior
that very red sources are rare confirms that this source is the optical
counterpart of the mid-IR bright red Spitzer source.
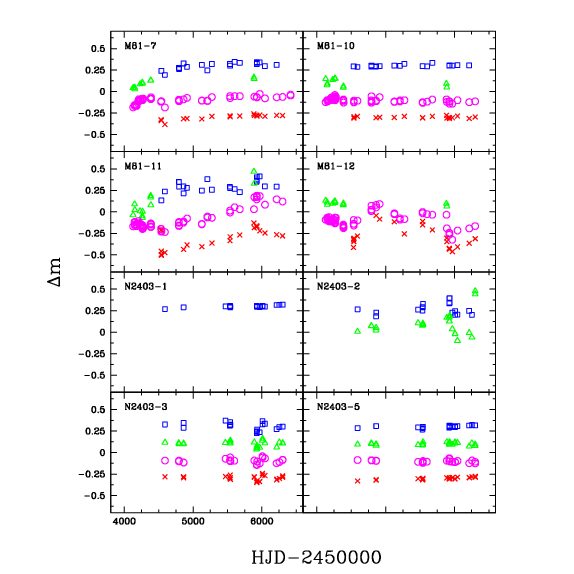
Fig.
5.— The differential light curves of some of the candidates in M81 and
NGC2403 obtained from the Large Binocular Telescope. The data spans the
period from March 2008 to January 2013. The U (squares), B (triangles),
V (circles), R (crosses) differential magnitudes are offset by +0.3,+0.1,−0.1,−0.3 mag for clarity.
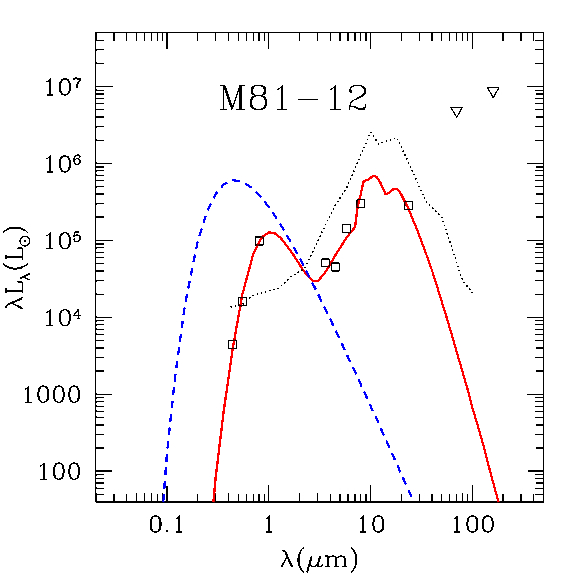
Fig.
6. —The best fit model (solid line) of the observed SED (squares and
triangles, the latter show flux upper limits) of M81-12 and the SED of
the underlying, unobscured star (dashed line), as compared to η Car
(dotted line). The best fit is for a L_∗ ≃ 10^5.9 L_⊙, T_∗ ≃ 7900K star
obscured by τ_V ≃ 8, T_d ≃ 530K silicate dust shell at R_in = 10^16.1 cm.
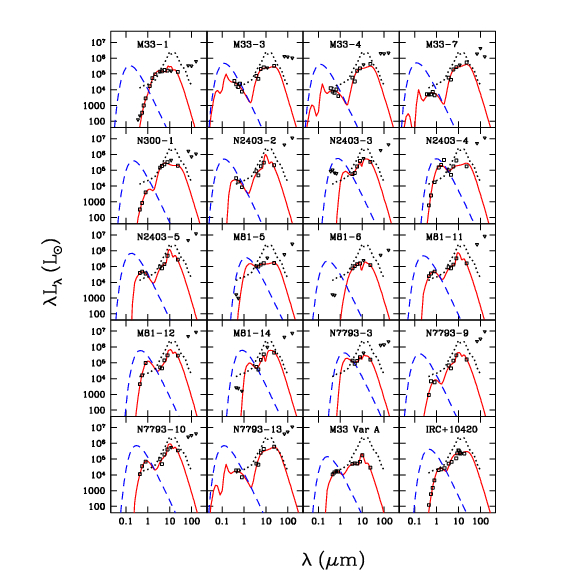
Fig.
7. — Same as Figure 6, but showing all the obscured stars that we
identified as compared to M33VarA, IRC +10420, and η Car. The solid
line shows the best fit model of the observed SED, and the dashed line
shows the SED of the underlying, unobscured star. M33VarA and IRC+10420
are shown on separate panel while η Car is shown on every panel (dotted
line).
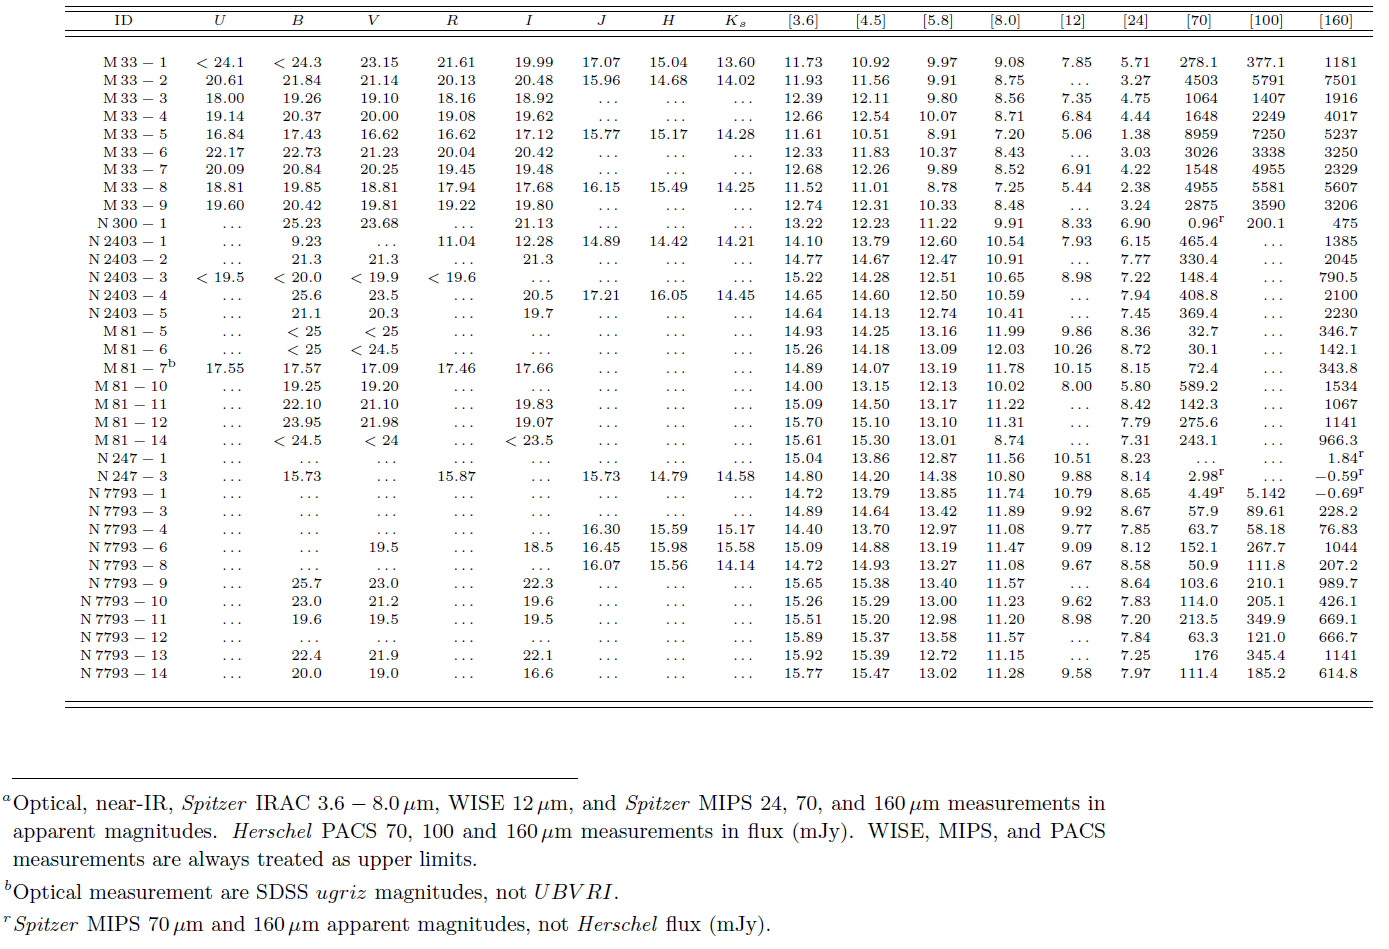
Table
2 — Optical through far-IR photometry. the extended SEDs are shown in Figures 7 and 8.
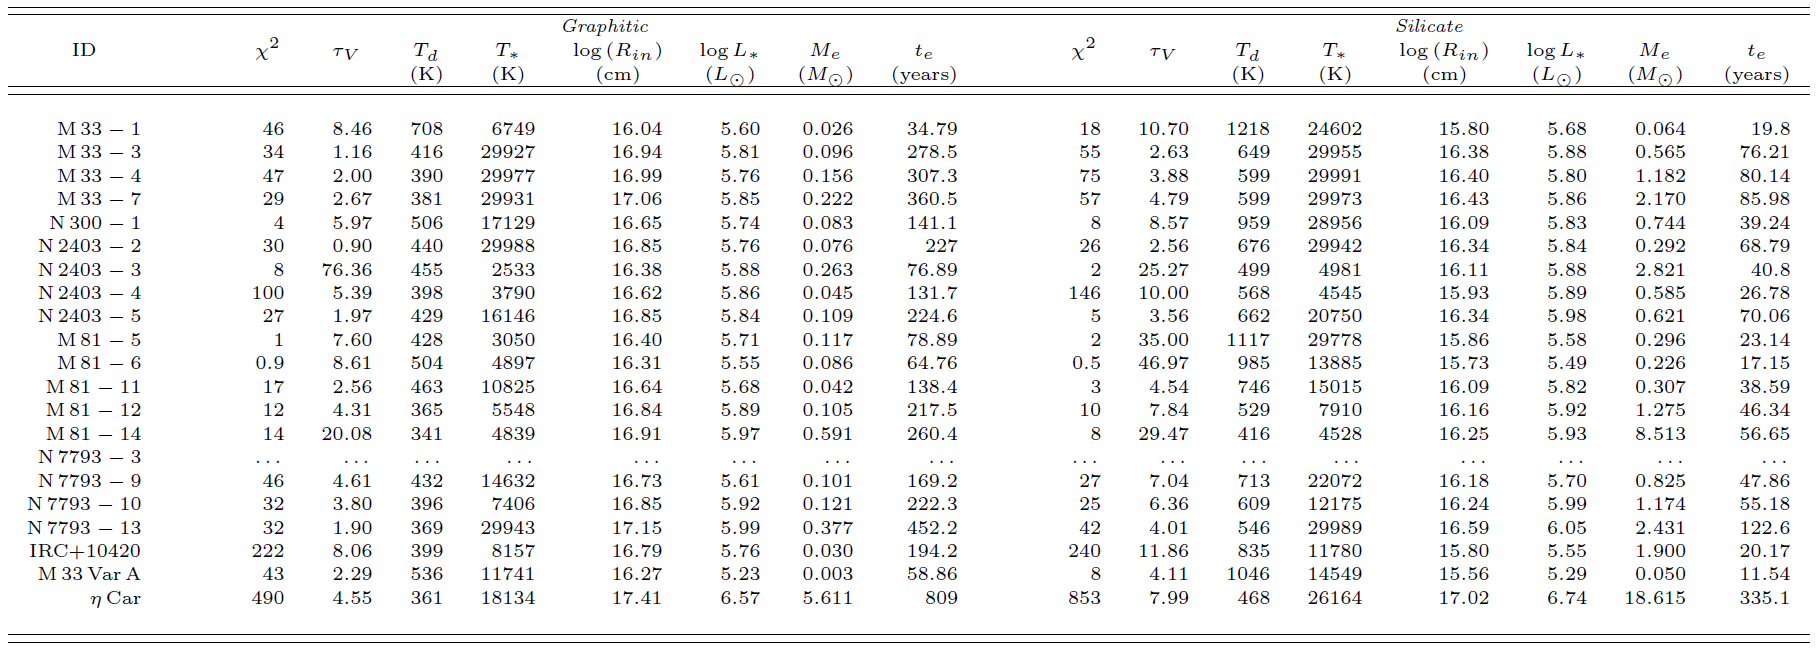
Table
3 — The best fit models. We fit the SEDs of the 18 self-obscured stars
using DUSTY (Ivezic & Elitzur 1997; Ivezic et al. 1999; Elitzur
& Ivezi´c 2001) to model radiation transfer through a spherical
dusty medium surrounding a star and Figure 7 shows the best fit models.
We estimate the properties of a black-body source obscured by a
surrounding dusty shell that would produce the best fit to the observed
SED (see Figure 6 for an example). We considered models with either
graphitic or silicate (Draine & Lee 1984) dust.
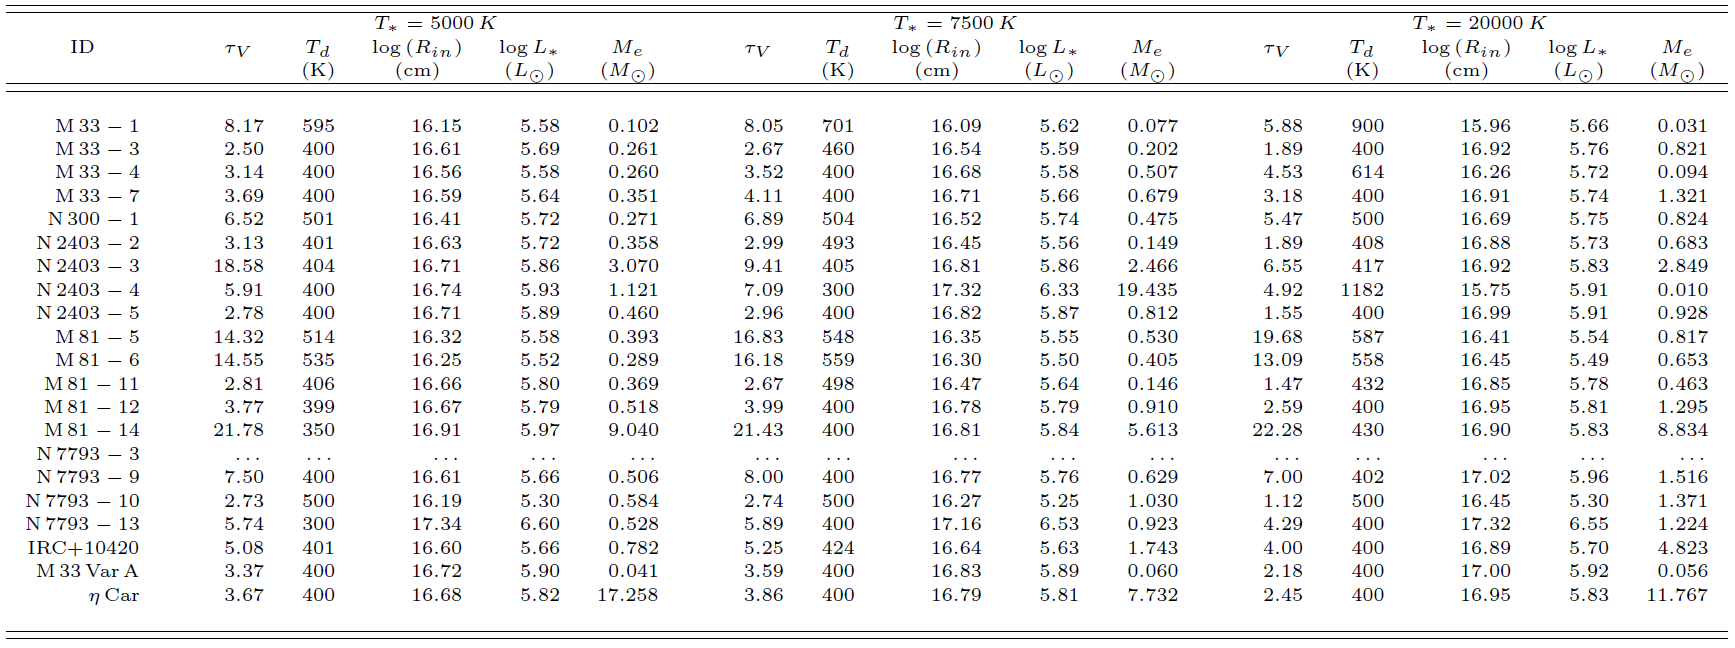
Table
4 — Best fit models for graphitic dust and fixed temperature. In some
cases, for different dust types, equally good models can be obtained
for either a hot (> 25000K, such as a LBV in quiescence) or a
relatively cooler (< 10000K, such as a LBV in outburst) star.
Indeed, for many of our 18 sources, the best fit is near the fixed
upper limit of T_∗ = 30000 K. To address this issue, we also tabulated
the models on a grid of three fixed stellar temperatures, T_∗ = 5000K,
7500K, 20000K, for each dust type. The resulting best fit parameters are reported in Tables 4 and 5.
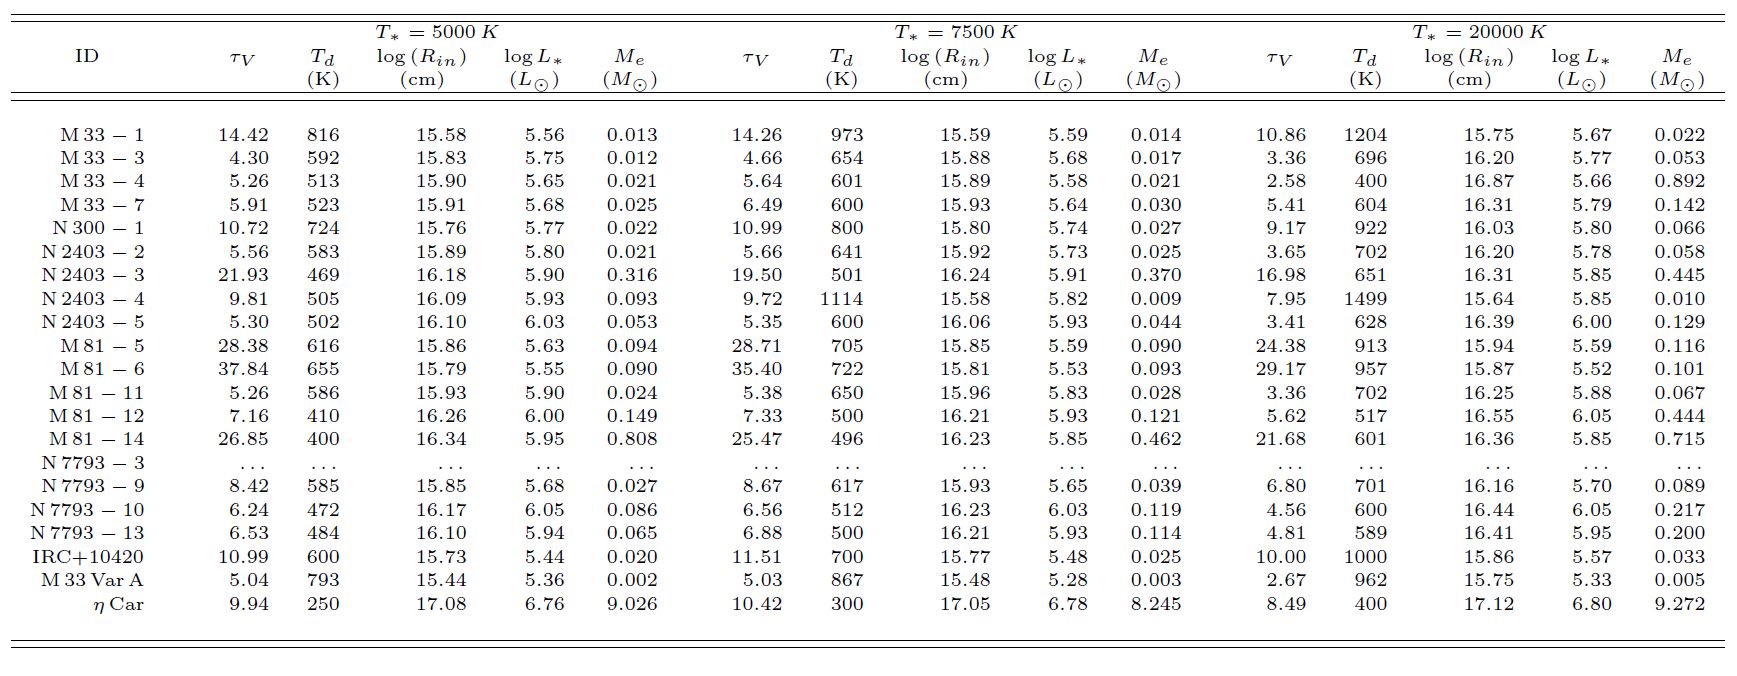
Table
5 — Best fit models for silicate dust and fixed temperature.
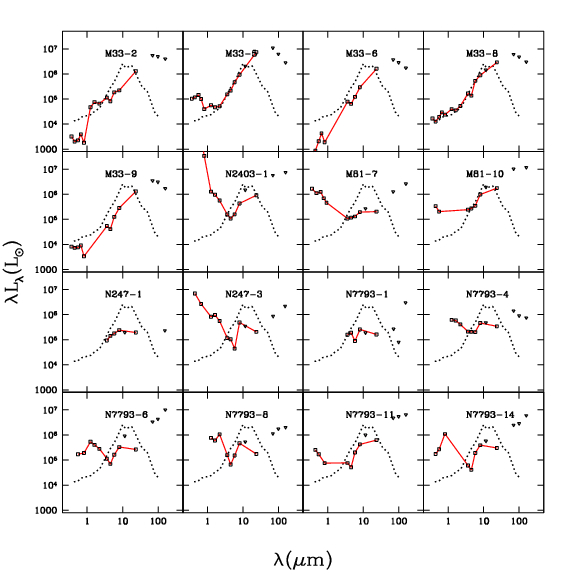
Fig.
8. — The SEDs of the 16 candidates that we concluded are not stars (points and solid lines) as compared to η Car (dotted line).
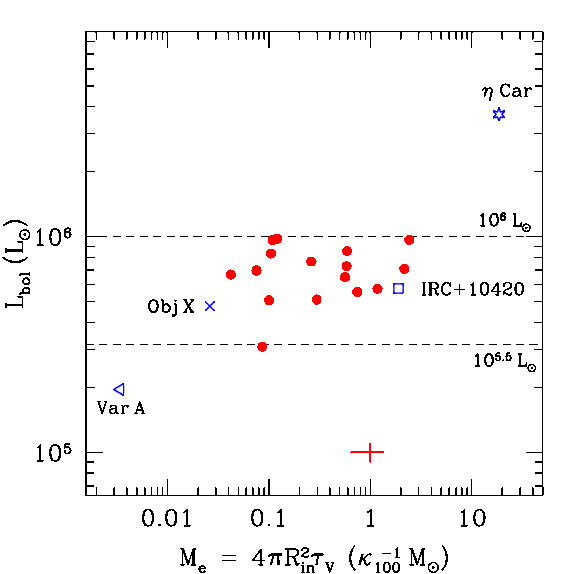
Fig.
9. — Luminosities of the obscured stars as a function of the estimated
ejecta mass determined from the best fit model for each SED. The dashed
lines enclose the luminosity range log(L/Lsun) ≃ 5.5 − 6.0. We do not
show N7793-3 for which we have no optical or near-IR data. IRC + 10420
(square), M33VarA (triangle), and η Car (star symbol) are shown for
comparison. The error bar corresponds to the typical 1σ uncertainties
on Lbol (±10%) and Me (±35%) of the best SED fit models.
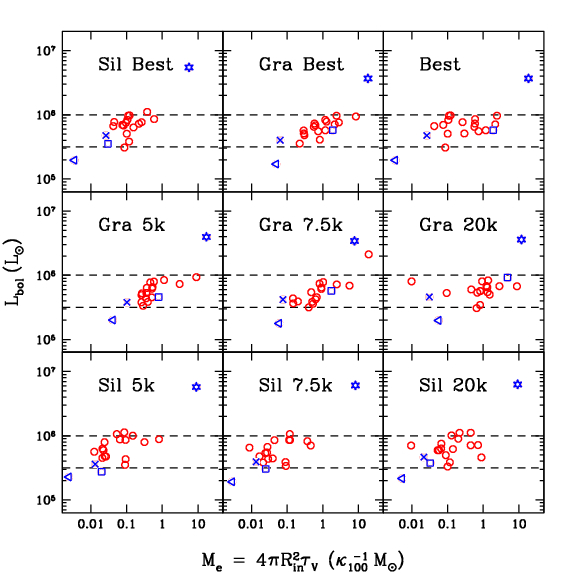
Fig.
10.— Fig. 10.— Same as Figure 9, but for different dust types and
temperature assumptions. The top row shows the best silicate (left),
graphitic (center), and the better of the two (right, same as Figure 9)
models. The middle and bottom rows show the best fit models for
graphitic and silicate dust at fixed stellar temperatures of 5000K,
7500K and 20000K. The only higher luminosity case in the fixed
temperature model panels is N2403-4, for which the best fit models have
significantly better fit and lower luminosities for both dust types.
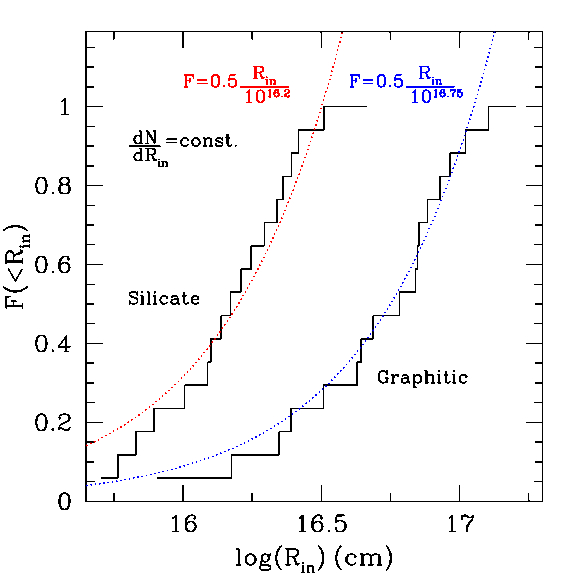
Fig.
11.— Cumulative histograms of the dust shell radius Rin for the newly
identified stars excluding N7793-3. The dotted lines, normalized to the
point where F(< Rin) = 0.5, shows the distribution expected for shells in uniform expansion observed at a random time.
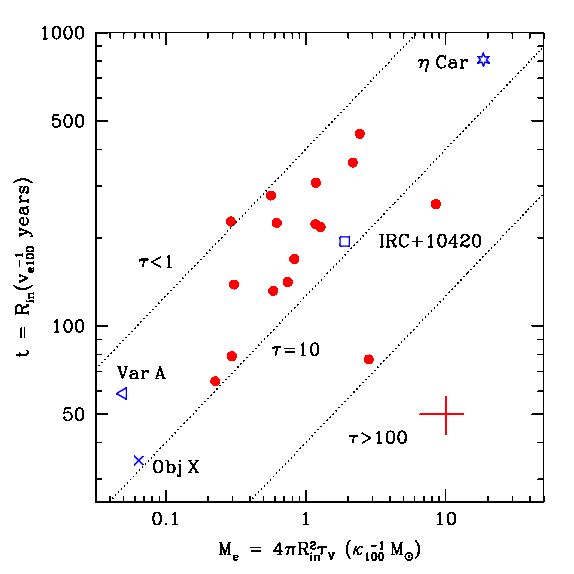
Fig.
12.— Elapsed time since eruption as a function of the estimated ejecta mass for the best fit graphitic models.
Acknowledgements:
We thank Hendrik Linz for helping us analyze the Herschel PACS data
and John Beacom for numerous productive discussions. We extend our
gratitude to the SINGS Legacy Survey and LVL Survey for making their
data publicly available. This research has made use of observations
made with the NASA/ESA Hubble Space Telescope, and obtained from the
Hubble Legacy Archive, which is a collaboration between the Space
Telescope Science Institute (STScI/NASA), the Space Telescope European
Coordinating Facility (ST-ECF/ESA) and the Canadian Astronomy Data
Centre (CADC/NRC/CSA). RK and KZS are supported in part by NSF grant
AST-1108687.