Next: Sources of Contamination Up: A Search for Car Previous: Targeted Galaxies
We used the Daophot/Allstar PSF-fitting and photometry package
(Stetson1992) to identify point sources in all four IRAC bands
and then performed photometry at the source location using both aperture
and PSF photometry.
We used the IRAF![]() ApPhot/Phot tool for the aperture photometry.
The aperture fluxes were transformed to Vega-calibrated magnitudes following the procedures
described in the Spitzer Data Analysis
Cookbook
ApPhot/Phot tool for the aperture photometry.
The aperture fluxes were transformed to Vega-calibrated magnitudes following the procedures
described in the Spitzer Data Analysis
Cookbook![]() and aperture corrections of 1.213, 1.234, 1.379, and 1.584 for the four IRAC bands.
The choice of extraction aperture aperture (
and aperture corrections of 1.213, 1.234, 1.379, and 1.584 for the four IRAC bands.
The choice of extraction aperture aperture (![]() ) as well as the inner (
) as well as the inner (![]() ) and outer
(
) and outer
(![]() ) radii of the local background annulus are reported in Table2.
We estimate the local background using a
) radii of the local background annulus are reported in Table2.
We estimate the local background using a ![]() outlier rejection procedure in
order to exclude sources located in the local sky annulus, and correct for the
excluded pixels assuming a Gaussian background distribution. Using a
background annulus immediately next to the signal aperture minimizes the effects of
background variation in the crowded fields of the galaxies.
We used the Daophot/Allstar package for PSF photometry.
The PSF photometry fluxes were transformed to Vega-calibrated magnitudes by
applying zero point offsets determined from the difference between the calibrated aperture
magnitudes and the initial PSF magnitude estimates of the bright stars in each galaxy.
outlier rejection procedure in
order to exclude sources located in the local sky annulus, and correct for the
excluded pixels assuming a Gaussian background distribution. Using a
background annulus immediately next to the signal aperture minimizes the effects of
background variation in the crowded fields of the galaxies.
We used the Daophot/Allstar package for PSF photometry.
The PSF photometry fluxes were transformed to Vega-calibrated magnitudes by
applying zero point offsets determined from the difference between the calibrated aperture
magnitudes and the initial PSF magnitude estimates of the bright stars in each galaxy.
For the 3.6 and 4.5![]() bands, after verifying consistency with the aperture magnitudes, we only use the Vega-calibrated PSF
magnitudes. For 5.8
bands, after verifying consistency with the aperture magnitudes, we only use the Vega-calibrated PSF
magnitudes. For 5.8![]() , we switch to aperture magnitudes when Allstar
fails to fit the PSF to a point source at the location identified by Daophot due to the decreasing resolution.
PSF photometry performs very poorly at 8.0
, we switch to aperture magnitudes when Allstar
fails to fit the PSF to a point source at the location identified by Daophot due to the decreasing resolution.
PSF photometry performs very poorly at 8.0![]() , leading
to both inaccurate photometry and many false sources because Daophot frequently
splits up extended regions of PAH emission into spurious point sources. Thus, at
8.0
, leading
to both inaccurate photometry and many false sources because Daophot frequently
splits up extended regions of PAH emission into spurious point sources. Thus, at
8.0![]() we only use aperture photometry at positions determined for sources identified in the
other three bands. We do not use this band for building our initial source list.
we only use aperture photometry at positions determined for sources identified in the
other three bands. We do not use this band for building our initial source list.
We define our initial source list as all point sources that have
![]() L
L![]() in any one of the 3.6, 4.5, and 5.8
in any one of the 3.6, 4.5, and 5.8![]() bands, excluding regions near saturated
stars and, in the case of M81, the high surface brightness core of the galaxy.
We identify sources in each of these three bands, and cross-match the
catalogs using a 1pixel matching radius. We then adopt the position determined at the
shortest wavelength (highest resolution) with a
bands, excluding regions near saturated
stars and, in the case of M81, the high surface brightness core of the galaxy.
We identify sources in each of these three bands, and cross-match the
catalogs using a 1pixel matching radius. We then adopt the position determined at the
shortest wavelength (highest resolution) with a ![]() detection, and we
use this position for the 8.0
detection, and we
use this position for the 8.0![]() aperture photometry.
We fit the mid-IR SED of each object as a power law in wavelength
aperture photometry.
We fit the mid-IR SED of each object as a power law in wavelength
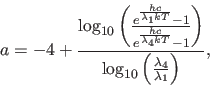
We defined candidates as sources with mid-IR luminosity
![]() L
L![]() ,
a mid-IR SED slope
,
a mid-IR SED slope ![]() , and
, and ![]() . Figures 2
and 3 show the distribution of point
sources in M81 with
. Figures 2
and 3 show the distribution of point
sources in M81 with
![]() L
L![]() in at least one of
the 3.6, 4.5, and 5.8
in at least one of
the 3.6, 4.5, and 5.8![]() IRAC bands as a function of
IRAC bands as a function of
![]() ,
, ![]() , and
, and ![]() . The open red triangles in these figures correspond to
candidates that are known to be non-stellar in nature (see Section2.3),
and the solid red triangles represent the surviving candidates. While a few
hundred sources in M81 are bright enough in the mid-IR to be included in these figures, only
a handful of these even remotely resemble
. The open red triangles in these figures correspond to
candidates that are known to be non-stellar in nature (see Section2.3),
and the solid red triangles represent the surviving candidates. While a few
hundred sources in M81 are bright enough in the mid-IR to be included in these figures, only
a handful of these even remotely resemble ![]() Car, and not a single
one of them is as luminous and as red (cold) as
Car, and not a single
one of them is as luminous and as red (cold) as ![]() Car. The other targeted
galaxies show similar distributions of sources. These distributions illustrate that
our selection criteria for identifying potential
Car. The other targeted
galaxies show similar distributions of sources. These distributions illustrate that
our selection criteria for identifying potential ![]() Car analogs
are robust and allows for selecting objects that are significantly less luminous in the
mid-IR and have much warmer circumstellar dust than
Car analogs
are robust and allows for selecting objects that are significantly less luminous in the
mid-IR and have much warmer circumstellar dust than ![]() Car. Table5
reports the survey area and the number of candidates found for each galaxy.
Car. Table5
reports the survey area and the number of candidates found for each galaxy.
We used aperture photometry to estimate the MIPS 24, 70, and 160![]() band
luminosities of the objects that meet our selection criteria. For point sources
that do not have a flux that is
band
luminosities of the objects that meet our selection criteria. For point sources
that do not have a flux that is
![]() above the local sky, we determine
the
above the local sky, we determine
the ![]() detection limit for each aperture location using the local background
estimate. Due to the poor spatial resolution of these bands, which forces us to
choose increasingly large apertures at longer wavelengths (see Table2),
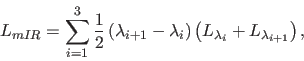
these measurements have limited utility. Figure5 shows the mid-IR
SEDs of the candidates we identified in M33 along with normal stars in the M33 image
selected from top left region of Figure5.
At 24
detection limit for each aperture location using the local background
estimate. Due to the poor spatial resolution of these bands, which forces us to
choose increasingly large apertures at longer wavelengths (see Table2),
these measurements have limited utility. Figure5 shows the mid-IR
SEDs of the candidates we identified in M33 along with normal stars in the M33 image
selected from top left region of Figure5.
At 24![]() , the SEDs of the normal stars show the expected slope for the Rayleigh-Jeans tail
of their SEDs, followed by an unphysical rise at 70 and 160
, the SEDs of the normal stars show the expected slope for the Rayleigh-Jeans tail
of their SEDs, followed by an unphysical rise at 70 and 160![]() .
Essentially, due to the poor resolution, the apertures used for these two bands include
many objects other than the intended target, and even normal stars appear to
have rising far-IR SEDs.
This means that we can generally use the 24
.
Essentially, due to the poor resolution, the apertures used for these two bands include
many objects other than the intended target, and even normal stars appear to
have rising far-IR SEDs.
This means that we can generally use the 24![]() fluxes while
the 70 and 160
fluxes while
the 70 and 160![]() measurements should be treated as upper limits
regardless of their origin. Nevertheless, the MIPS bands are useful as a qualitative
constraint on an object's physical nature (i.e. if it is a galaxy, QSO, cluster etc.).
measurements should be treated as upper limits
regardless of their origin. Nevertheless, the MIPS bands are useful as a qualitative
constraint on an object's physical nature (i.e. if it is a galaxy, QSO, cluster etc.).