

Early Release Data Description
3. Early Release Download Data
5. Quick Look (Basic) Imaging File Description
6. Quick Look (Basic) Spectroscopy File Description
1. Overview
The early data release contains images and catalogs generated by the GALEX data pipeline in Nov-Dec 2003. These data products are representative of what will be provided to Guest Investigators and to the astronomical community in the first major public data release (DR1) in Fall 2004. This document describes the release data and provides additional information regarding data collection modes, performance parameters and pipeline performance.
2. Early Release Description
The GALEX surveys are on-going. At the start of December 2003, GALEX has already observed over 3000 square degrees of sky during more than 2000 orbits. For the all-sky and medium imaging surveys, the early release observations contain less than 1% of what has been collected to date, with the single DIS/WSS field one of 10-15 deep fields that has been observed.
Figure 1.1 below shows the location of the ERO targets. The ERO fields and exposure times were selected to provide a representative data set for use by prospective investigators. Targets observed at different Galactic latitudes with varying infrared cirrus levels (100 mm) have a wide range of extinction values and UV background levels The median cirrus level over the whole sky is ~ 3.0 MJy/sr. GALEX deep imaging and spectroscopy fields are generally selected to have I100 < 1.0 MJy/sr. Currently the All-sky survey is limited to fields with cirrus levels below 3.0 MJy/sr.
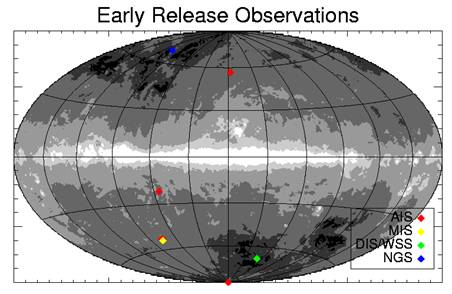
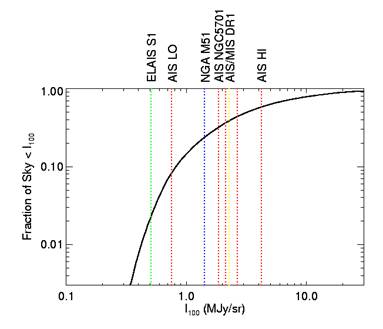
Figure 1 .1 (a) Aitoff projection of SFD dust maps (Galactic coordinates) w/ ERO target locations indicated. (b) Cumulative distribution of cirrus and levels for ERO targets.
Survey |
TARGET |
RA |
DEC |
GLON |
GLAT |
I100 |
E(B-V) |
EXP |
COMMENTS |
AIS |
AISCHV2_275_30470_0001_sv06 |
12.89 |
-27.23 |
290 |
-89.8 |
0.75 |
0.015 |
109 |
High Galactic Latitude |
AIS |
AISCHV2_160_19659_0001_sv01 |
312.83 |
8.71 |
55.7 |
-22 |
4.2 |
0.080 |
115 |
Low Galactic Latitude |
AIS |
AISCHV2_153_29114_0002_sv10 |
347.56 |
-0.20 |
76.7 |
-54 |
2.3 |
0.049 |
113 |
Overlaps SDSS DR1 |
AIS |
AISCHV2_153_29114_0002_sv11 |
346.98 |
0.67 |
76.9 |
-53 |
2.1 |
0.049 |
111 |
Overlaps SDSS DR1 |
AIS |
AISCHV2_153_29114_0002_sv12 |
346.50 |
-0.11 |
75.4 |
-53 |
2.6 |
0.055 |
113 |
Overlaps SDSS DR1 |
AIS |
AISGRID_359_33627_0001_sv03 |
219.68 |
5.31 |
357.2 |
56.4 |
1.8 |
0.035 |
238 |
NGC 5701 gorgeous ring-bar liner |
MIS |
MISDR1_29116_0381_0001 |
347.56 |
-0.20 |
76.69 |
-54 |
2.3 |
0.049 |
1492 |
Overlaps SDSS DR1 |
NGS |
NGS_M51 |
201.90 |
47.07 |
104.9 |
68.5 |
1.4 |
0.022 |
1412 |
The Whirlpool Galaxy |
DIS |
ELAISS1_00 |
9.64 |
-43.99 |
-72 |
-43 |
0.5 |
0.007 |
12198 |
~1/3 planned DIS depth |
WSS |
ELAISS1_00 |
9.64 |
-43.99 |
-72 |
-43 |
0.5 |
0.007 |
31267 |
DIS used for detection image |
3.
Early Release Download Data
The ERO release includes two categories of release files. A "basic" set provides the user with a minimal source extraction catalog and images which can be used for an initial "quick look". We also provide an "advanced" set which contains the full complement of pipeline outputs for each of these observations. Many of these outputs are beyond the scope of this document and will be described in more detail elsewhere. Nevertheless, many users---particularly potential Guest Investigators---may find it useful to explore the full set of pipeline outputs.
For a single imaging target, six files are available for download:
1. Imaging Basic Data Set
a. gzipped tar file (containing the two image and two catalog files listed below)
d. Basic matched catalog [fits]
e. Basic matched catalog [text]
2. Imaging Full Data Set
a. gzipped tar file (contains the full pipeline output directory)
For a single spectroscopy target, two files are available for download:
3. Spectroscopy Basic Data Set
a. 1-D Combined Spectra [fits]
4. Spectroscopy Full Data Set
a. gzipped tar file (contains the full pipeline output directory)
All of these files may be downloaded by using the available links. The gzipped tar files for the full pipeline directories may be quite large (several hundred GB).
4. Filenaming Convention
A filename contains a basename (or prefix), a suffix and an extension. (e.g. AISCHV2_153_29114_0002_sv11-xd-mcat.fits)
The filename basename contains alphanumeric characters (of unspecified length, but containing no hyphens or periods, e.g. "AISCHV2_153_29114_0002_sv11" above). Typically this basename is related to the observed target. Files in directories containing multi-leg observations (e.g. all-sky survey) will have "_sv##" appended to the prefix with ## indicating the number of the sub-visit of that particular leg. No other requirements have been placed on the filename prefix.
The filename suffix contains delimited file type descriptor strings. Table XX shows the full set of files currently being generated by orbpipe. The rows in bold indicate those files that will be most useful for a first look at the GALEX data. The filename suffix may begin with a band/mode substring:
-nd- NUV direct (imaging)
-fd- FUV direct (imaging)
-xd- Merged direct (imaging)
-ng- NUV grism
-fg- FUV grism
-xg- Merged grism
-no- NUV opaque
-fo- FUV opaque
Pipeline files which are generated for both NUV and FUV are indicated with "[n or f]" in the pipeline products table.
5. Quick Look (Basic) Imaging File Description
-[f,n]d-int.fits:
fits images from fuv [f] or nuv [n] channel in the imaging (direct d) mode. Images are intensity maps [int] which are created from count [cnt] images [in detected counts=photons], divided by exposure [exp] images [in seconds]. Images are 3840 by 3840 pixels, pixels are 1.5"x1.5" arcseconds. 1 count in a pixel corresponds roughly to a flat-fielded 1 ct/s. These images are not background subtracted. Image is in pixels with J2000 world coordinate system (WCS). Image can be immediately viewed in sky coordinates using ds9, gaia, or other image viewing routines.
-mcat_basic.fits:
reduced fits binary table of matched (FUV+NUV) sources detected from a single image.
-mcat_basic.txt:
text table of matched (FUV+NUV) sources with key subset of source attributes available in full .fits table.
Table 1.2 -- Extracted columns in text matched catalog:
Parameter |
Units |
Format |
Content |
RA_J2000, DEC_J2000 |
Degrees [decimal] |
J2000 RA & DEC of matched source position |
|
mag_FUV |
AB magnitude |
Calibrated FUV magnitude |
|
mag_err_FUV |
AB magnitude |
Calibrated FUV magnitude error |
|
mag_NUV |
AB magnitude |
Calibrated NUV magnitude |
|
mag_err_NUV |
AB magnitude |
Calibrated NUV magnitude error |
|
F_FUV |
mJy |
Calibrated FUV flux |
|
F_err_FUV |
mJy |
Calibrated FUV flux error |
|
F_NUV |
mJy |
Calibrated NUV flux |
|
F_err_NUV |
mJy |
Calibrated NUV flux error |
|
Artifact FLAG |
Bit |
Artifact flags |
|
2nd moment FUV |
Arcsec |
Rms object size |
|
2nd moment NUV |
Arcsec |
Rms object size |
|
E(B-V) |
Mag |
Galactic reddening obtained from Schlegel, REF. |
6. Quick Look (Basic) Spectroscopy File Description
-xg-gsp.fits file
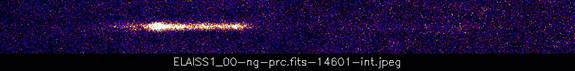
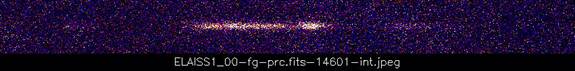
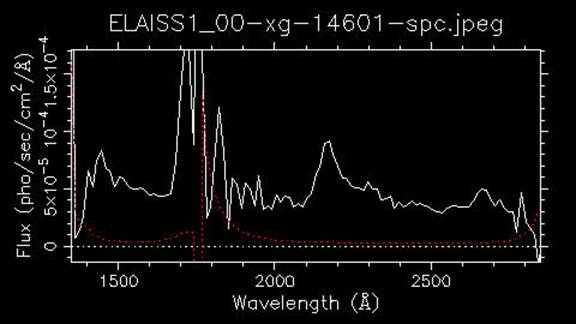
The xg-gsp.fits file is the final product from the spectroscopy pipeline. From the spectral image strip files (-?g-pri.fits), uncalibrated spectra are extracted and stored in extracted spectra files (-[n,f]g-xsp.fits). These files are then combined to create the *-xg-gsp.fits file which contains the band-combined flux-calibrated extracted spectra data, in units of photons per second per centimeter squared per Angstrom vs. Angstrom, on a linear dispersion scale. The range is roughly
1300 to 3000 Angstroms. The two bands are joined at approximately 1800 Angstroms with no overlapping region.
After a combined strip is built up from individual grism rotation image strips, a final merged, flux calibrated spectrum is extracted and stored in the xg-gsp.fits file. In this example from the ELAISS1_00 WSS data, GALEX has detected a known quasar and also an X-ray source (Alexander et al (2001) object #11) at z=0.398. OVI, Lyman Alpha, C IV, CIII lines are seen at measured wavelengths (1445, 1700, 2165 and 2660 respectively).
The following table contains a description of the xg-gsp file columns.
Parameter |
Format |
Description |
|
ggoid |
1 |
(2J) |
Global ID of spectral source |
ggoid_D |
2 |
(2J) |
Global ID of direct image source |
band |
3 |
(1J) |
1=nuv only, 2=fuv only, 3=both |
id |
4 |
(1J) |
Spectral source ID { corresponds to direct image catalog ID } |
alpha_j2000 |
5 |
(1D) |
Right Ascension J2000 (deg) |
delta_j2000 |
6 |
(1D) |
Declination J2000 (deg) |
numpt |
7 |
(1J) |
Number of points in spectra |
truthid |
8 |
(1J) |
Truth catalog ID (matched) { used only for simulations, not real data } |
objtype |
9 |
(1J) |
Object Type(0=galaxy,1=star) { a guess based on FUV - NUV color. } |
temperature |
10 |
(1E) |
Estimated effective temper.(K) |
redshift |
11 |
(1E) |
Estimated redshift { not used yet } |
slope |
12 |
(1E) |
Estimated spectral slope |
weight |
13 |
(2E) |
Average weight (each band) { effective exposure (response) } |
background |
14 |
(2E) |
Average background (each band) |
median_s2n |
15 |
(2E) |
Median Signal/Noise (each band) |
centroid |
16 |
(2E) |
Relative position(spatial)(each) { spatial centroid on spectral image strip } |
specfwhm |
17 |
(2E) |
Estim. Spatial FWHM (each band) { arcseconds } |
nuv_numpro |
18 |
(1J) |
Number of points in NUV profile |
fuv_numpro |
19 |
(1J) |
Number of points in FUV profile |
nuv_profile |
20 |
(79E) |
NUV profile (spatial) |
fuv_profile |
21 |
(79E) |
FUV profile (spatial) { spatial profile using a high response region of spectral image strip } |
nuv |
22 |
(1E) |
Direct image flux rate (NUV) |
nuve |
23 |
(1E) |
Error in direct image flux rate |
fuv |
24 |
(1E) |
Direct image flux rate (FUV) |
fuve |
25 |
(1E) |
Error in direct image flux rate |
nuvs |
26 |
(1E) |
Spectral flux scaled to direct |
nuvse |
27 |
(1E) |
Error in nuvs |
fuvs |
28 |
(1E) |
Spectral flux scaled to direct |
fuvse |
29 |
(1E) |
Error in fuvs { columns 26-29 use the extrapolations for wings of response functions } |
nuv0s |
30 |
(1E) |
NUV Zeroth order flux rate |
nuv0se |
31 |
(1E) |
label for field 31 |
nuv1s |
32 |
(1E) |
NUV First order flux rate |
nuv1se |
33 |
(1E) |
label for field 33 |
nuv2s |
34 |
(1E) |
NUV Second order flux rate |
nuv2se |
35 |
(1E) |
label for field 35 |
fuv1s |
36 |
(1E) |
FUV First order flux rate |
fuv1se |
37 |
(1E) |
label for field 37 |
fuv2s |
38 |
(1E) |
FUV Second order flux rate |
fuv2se |
39 |
(1E) |
label for field 39 |
fuv3s |
40 |
(1E) |
FUV Third order flux rate |
fuv3se |
41 |
(1E) |
label for field 41 { columns 30-41 use selected high response regions } |
zero |
42 |
(1E) |
Wavelength of first pixel (Ang.) |
disp |
43 |
(1E) |
Angstroms per pixel { The zero and disp values set the linear wavelength scale |
obj |
44 |
(488E) |
Flux (pho/sec/cm^2/Ang) (standard) |
objerr |
45 |
(488E) |
Error on obj { Calibrated spectral data. This extraction is a simple summation of the object region after subtracting off the average background at each spectral point. } |
opx |
46 |
(488E) |
Flux (pho/sec/cm^2/Ang) (optimal) |
opxerr |
47 |
(488E) |
Error on opx { Optimal extraction arrays not used yet. } |
Responsible NASA Official: Susan G. Neff
Curators: Joan E. Hollis and Joel D. Offenberg