Census of
Self-Obscured Massive Stars in Nearby Galaxies with Spitzer:
Implications for Understanding the Progenitors of SN 2008S-Like
Transients
Rubab Khan, K. Z. Stanek, J. L. Prieto, C. S. Kochanek, Todd A. Thompson, J. F. Beacom
Abstract:
A
new link in the causal mapping between massive stars and potentially
fatal explosive transients opened with the 2008 discovery of
the
dust-obscured progenitors of the luminous outbursts in NGC 6946 and NGC
300. Here we carry out a systematic mid-IR photometric search
for
massive, luminous, self-obscured stars in four nearby galaxies:
M33, NGC 300, M81, and NGC 6946. For detection, we
use only the
3.6 micron and 4.5 micron IRAC bands, as these can still be
used for
multi-epoch Spitzer surveys of nearby galaxies (=<10 Mpc). We
combine familiar PSF and aperture-photometry with an
innovative
application of image subtraction to catalog the self-obscured massive
stars in these galaxies. In particular, we verify that stars
analogous
to the progenitors of the NGC 6946 (SN 2008S) and NGC 300
transients
are truly rare in all four galaxies: their number may be as low as ~1
per galaxy at any given moment. This result empirically
supports the
idea that the dust-enshrouded phase is a very short-lived phenomenon in
the lives of many massive stars and that these objects
constitute a
natural extension of the AGB sequence. We also provide mid-IR
catalogs
of sources in NGC 300, M81, and NGC 6946.
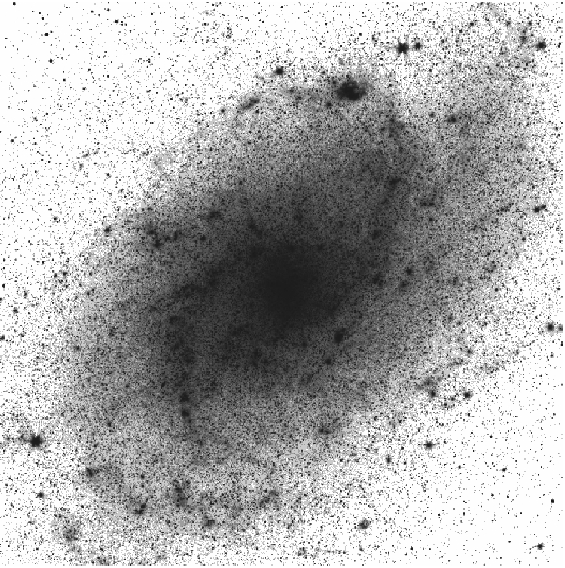
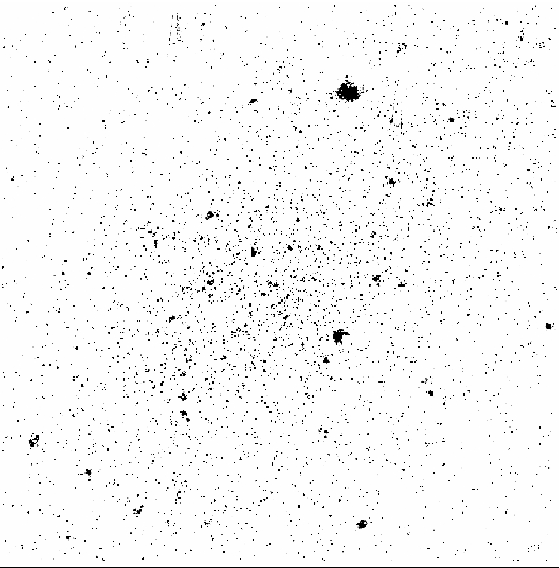
Fig.
1.— M33 4.5 μm IRAC image (left) and [3.6]−[4.5] differenced image
(right). The image covers an area of ~ 33' ×33' (1600×1600 pixels,
with 1.2"/pixel). This difference image is constructed by using image
subtraction to scale and subtract the 3.6 μm image from the 4.5
μm image including the necessary corrections for the PSF differences.
All the normal (non-red) stars “vanish” in the differenced image leaving the stars with significant
dust emission.
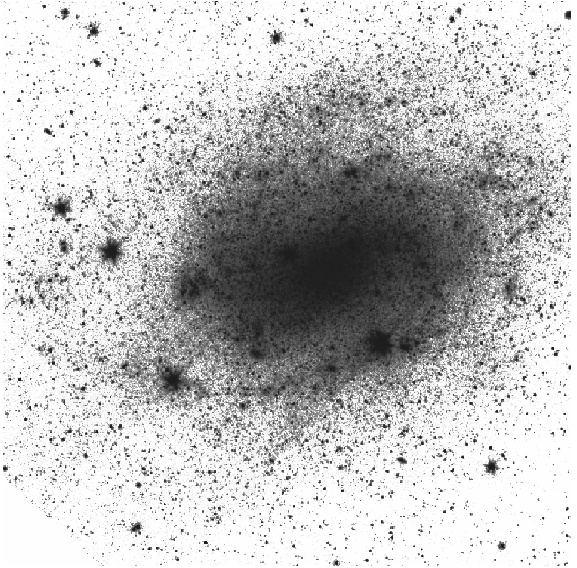
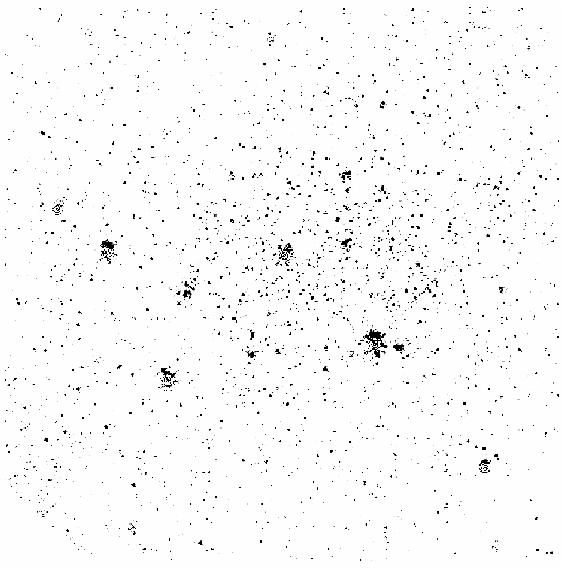
Fig.
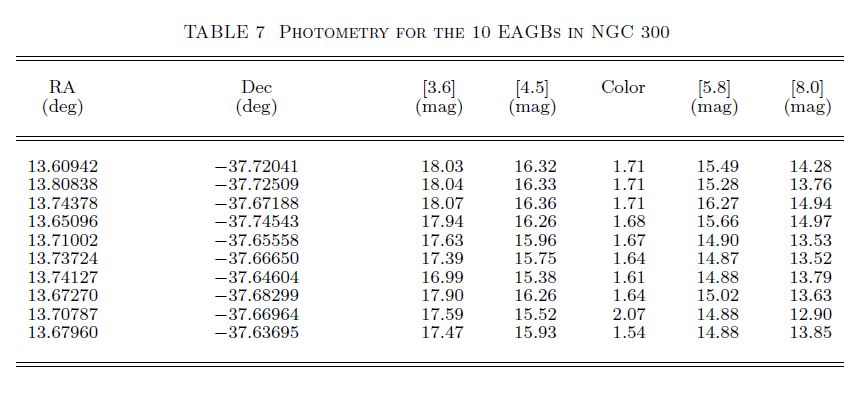
2.— NGC 300 4.5 μm IRAC image (left) and [3.6] − [4.5] differenced
image (right), as in Figure 1. The image covers an area of ~ 15' × 15' (1250 × 1250 pixels with
0.75"/pixel).
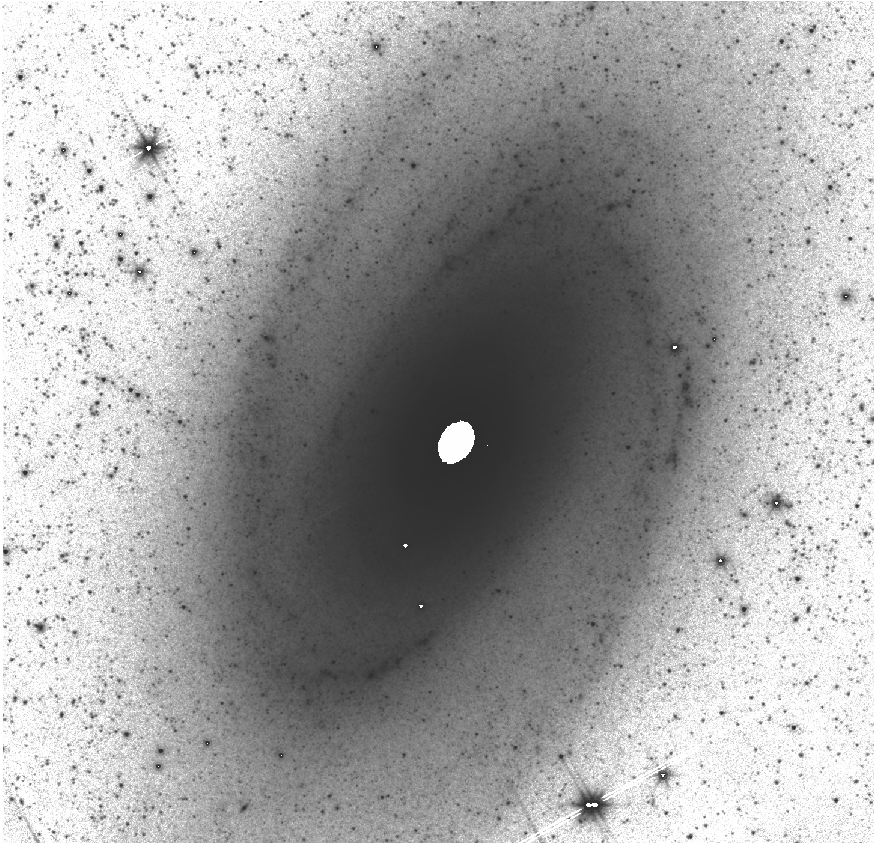
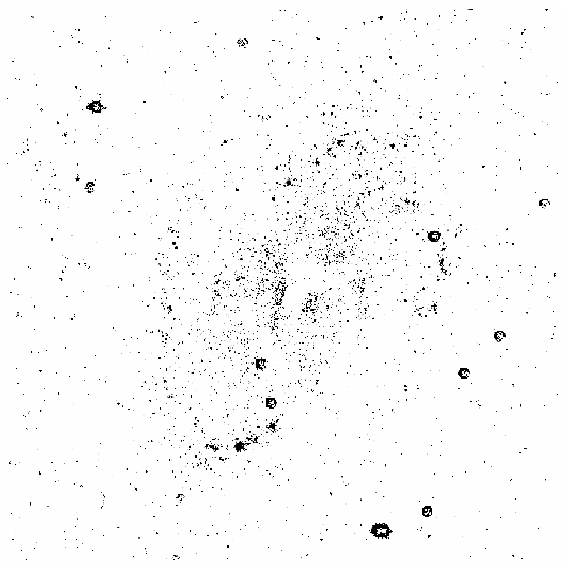
Fig.
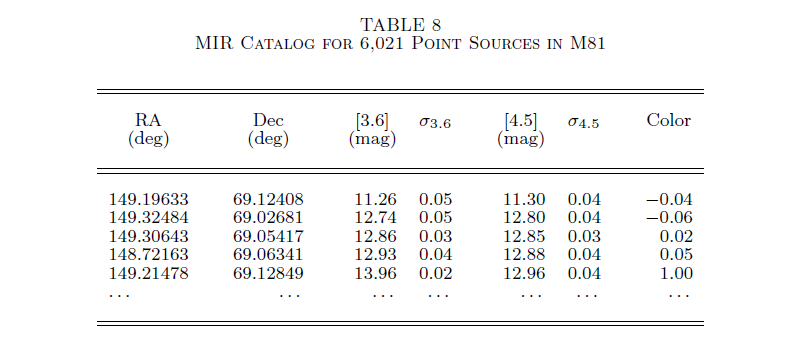
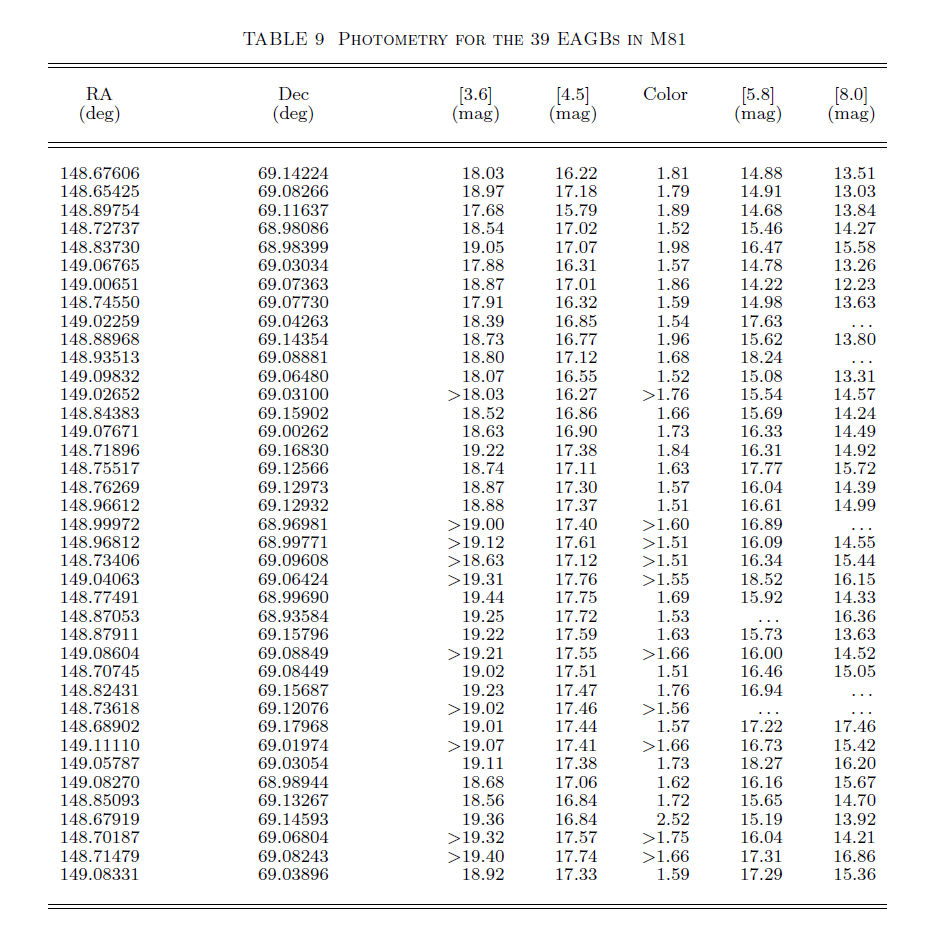
3.— M81 4.5 μm IRAC image (left) and [3.6]−[4.5] differenced image
(right), as in Figure 1. The image covers an area of ~ 18'×18' (1450 ×
1450 pixels with 0.75"/pixel). The saturated center of M81 has been
masked for data reduction purposes.
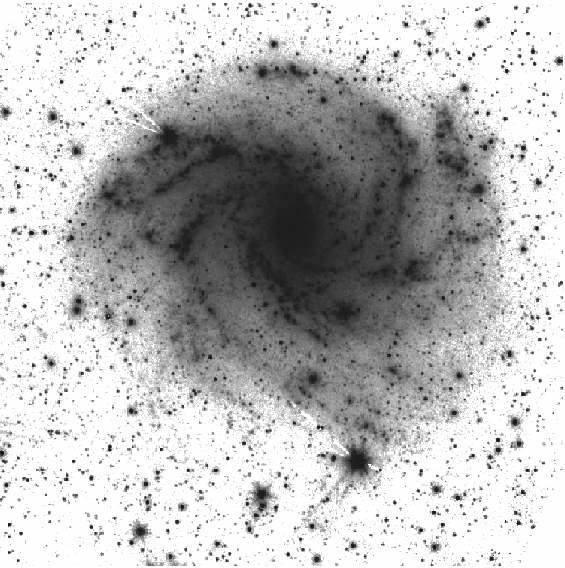
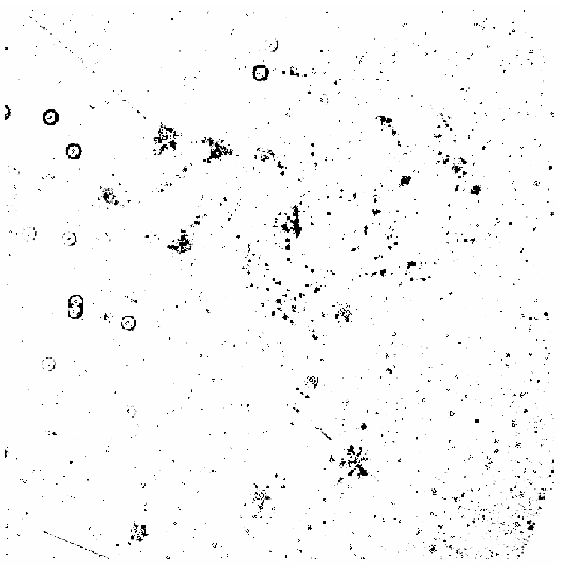
Fig.
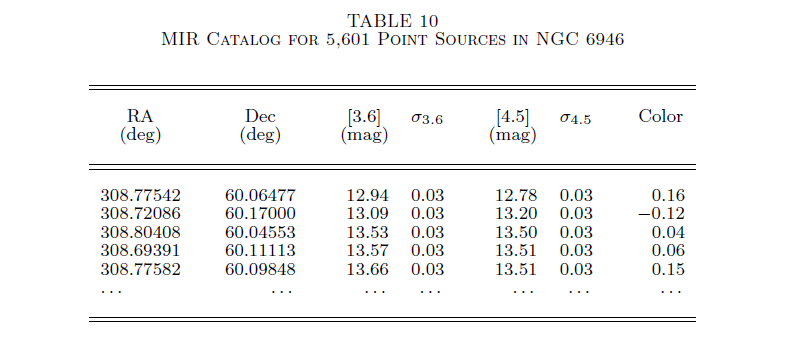
4.— NGC 6946 4.5 μm IRAC image (left) and [3.6] − [4.5] differenced
image (right), as in Figure 1. The image covers an area of ~ 12' × 12'
(1000 × 1000 pixels with 0.75"/pixel). The 4.5 μm SINGS archival image
contains many artifacts that significantly affect the subtracted image.
For example, bright stars show bright “halos” in the 4.5 μm image that
appear as rings in the subtracted image.
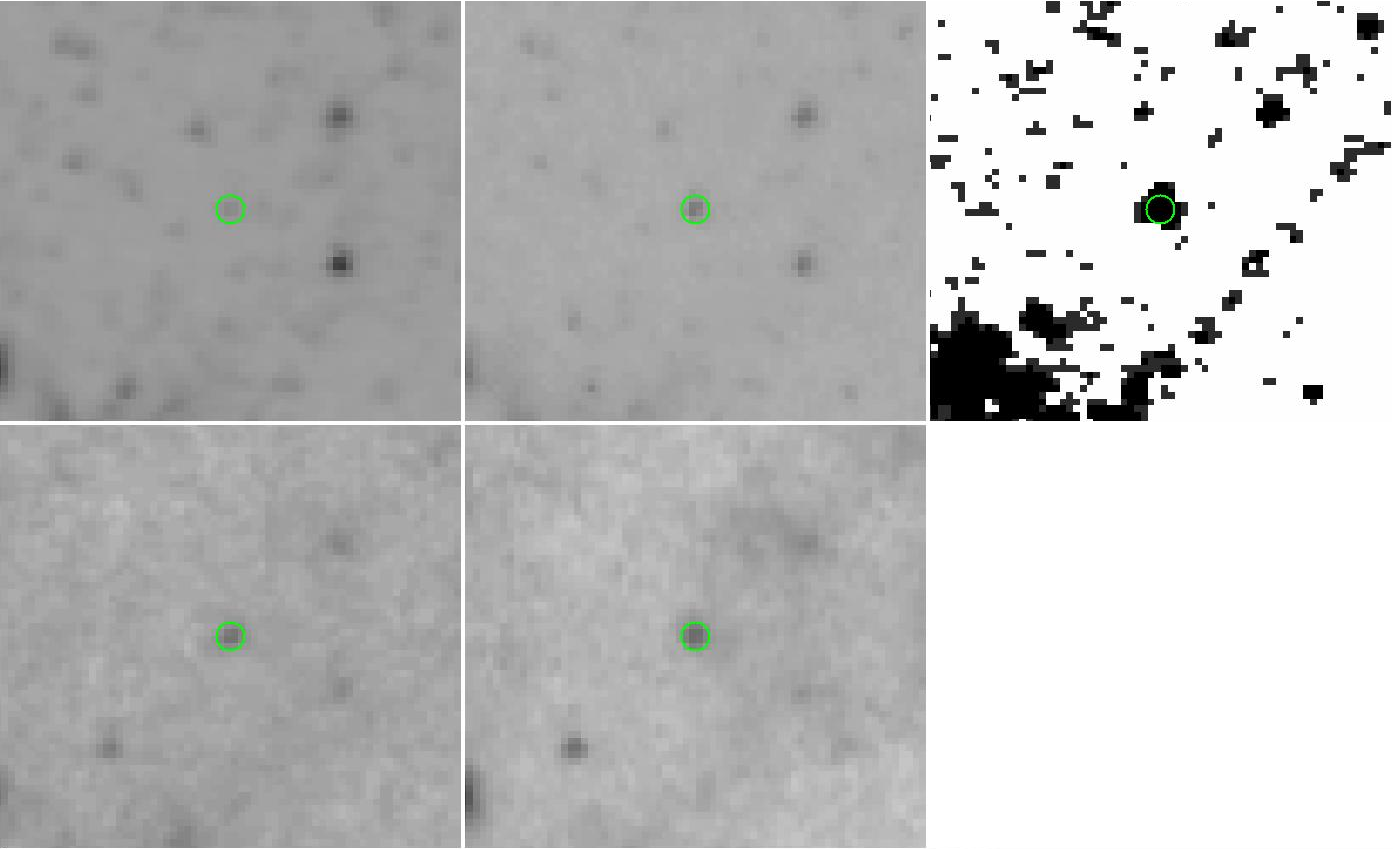
Fig.
5.— A Class–A object in NGC 300 visible at both 3.6 μm (top left) and
4.5 μm (top center). The [3.6]−[4.5] difference (top right), 5.8 μm
(bottom left ), and 8.0 μm (bottom center) images are also shown. Each
panel is ~52.5" on its sides.
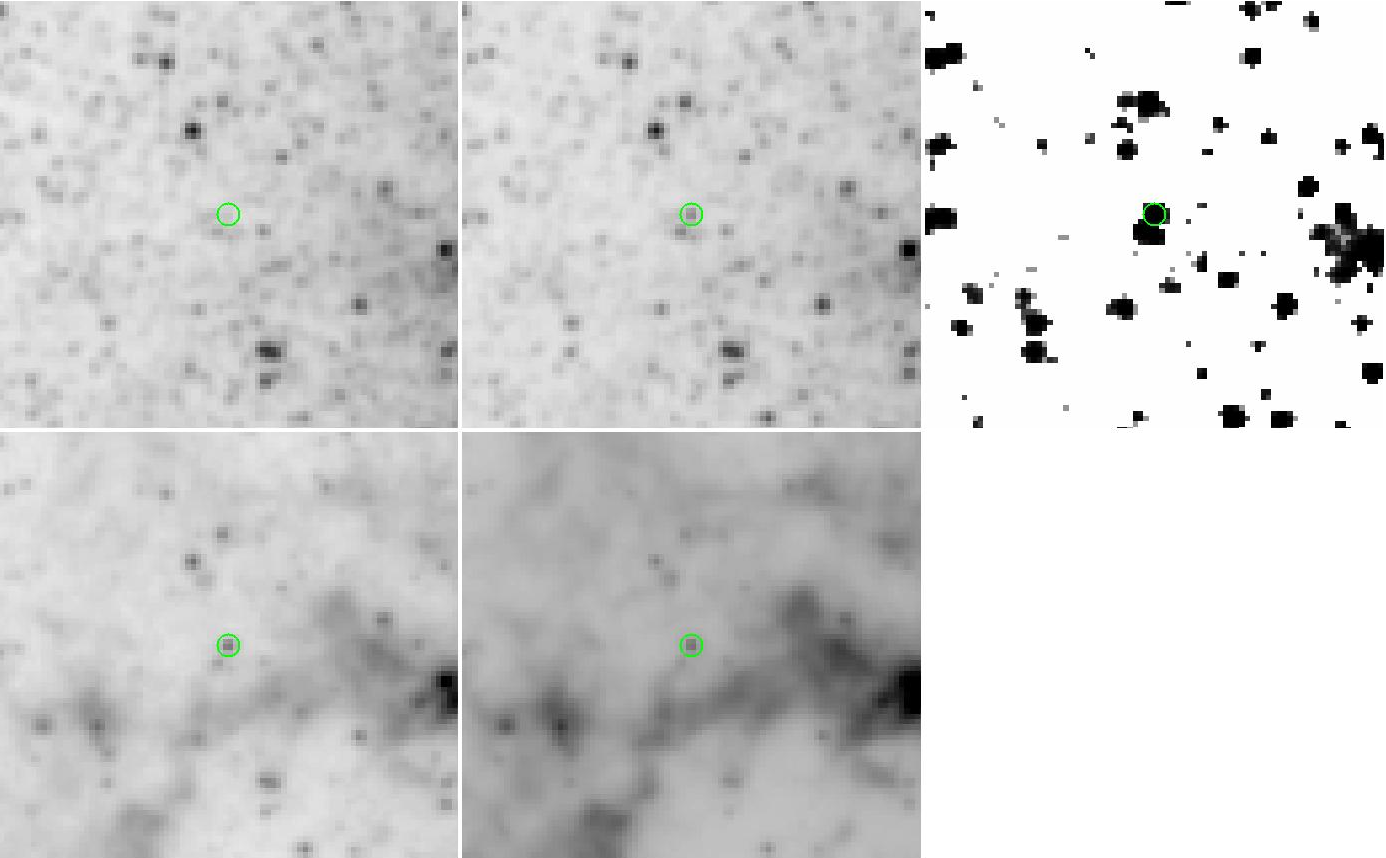
Fig.
6.— A Class–B object in M33 visible only at 4.5 μm (top center) and not
at 3.6 μm (top left ). The 3.6 μm magnitude is determined at the
position of the 4.5 μm source. The [3.6] − [4.5] difference (top
right), 5.8 μm (bottom left ), and 8.0 μm (bottom center) images are
also shown. Each panel is ~106.4" on its sides.
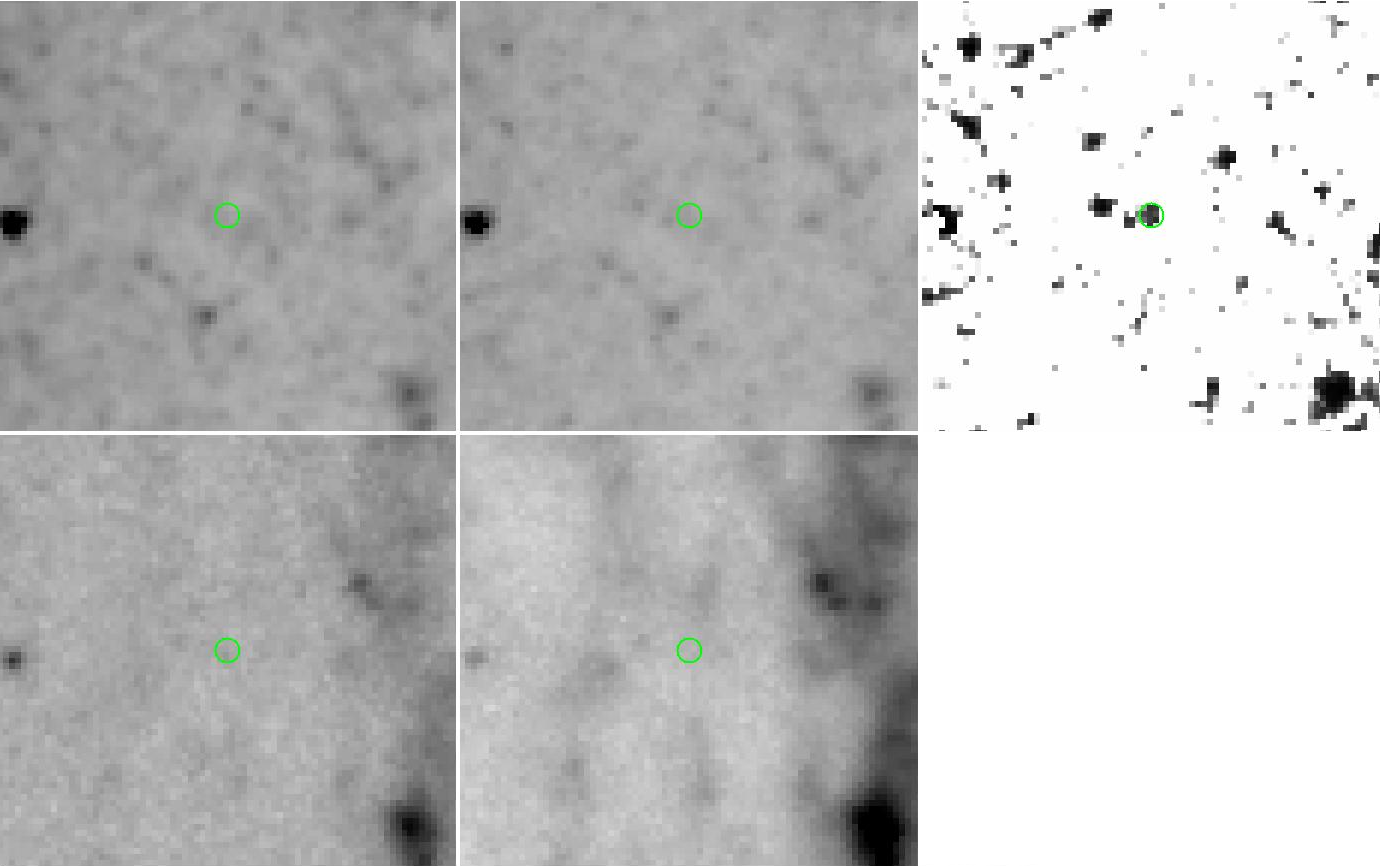
Fig.
7.— A Class–C object in M81 found only in the [3.6] − [4.5] wavelength
differenced image (top right) but at neither 3.6 μm (top left) nor 4.5
μm (top center). The magnitudes are determined through
aperture-photometry at the location identified in the differenced
image. The 5.8 μm (bottom left) and 8.0 μm (bottom center) images are
also shown. Each panel is ~60.0" on its sides.
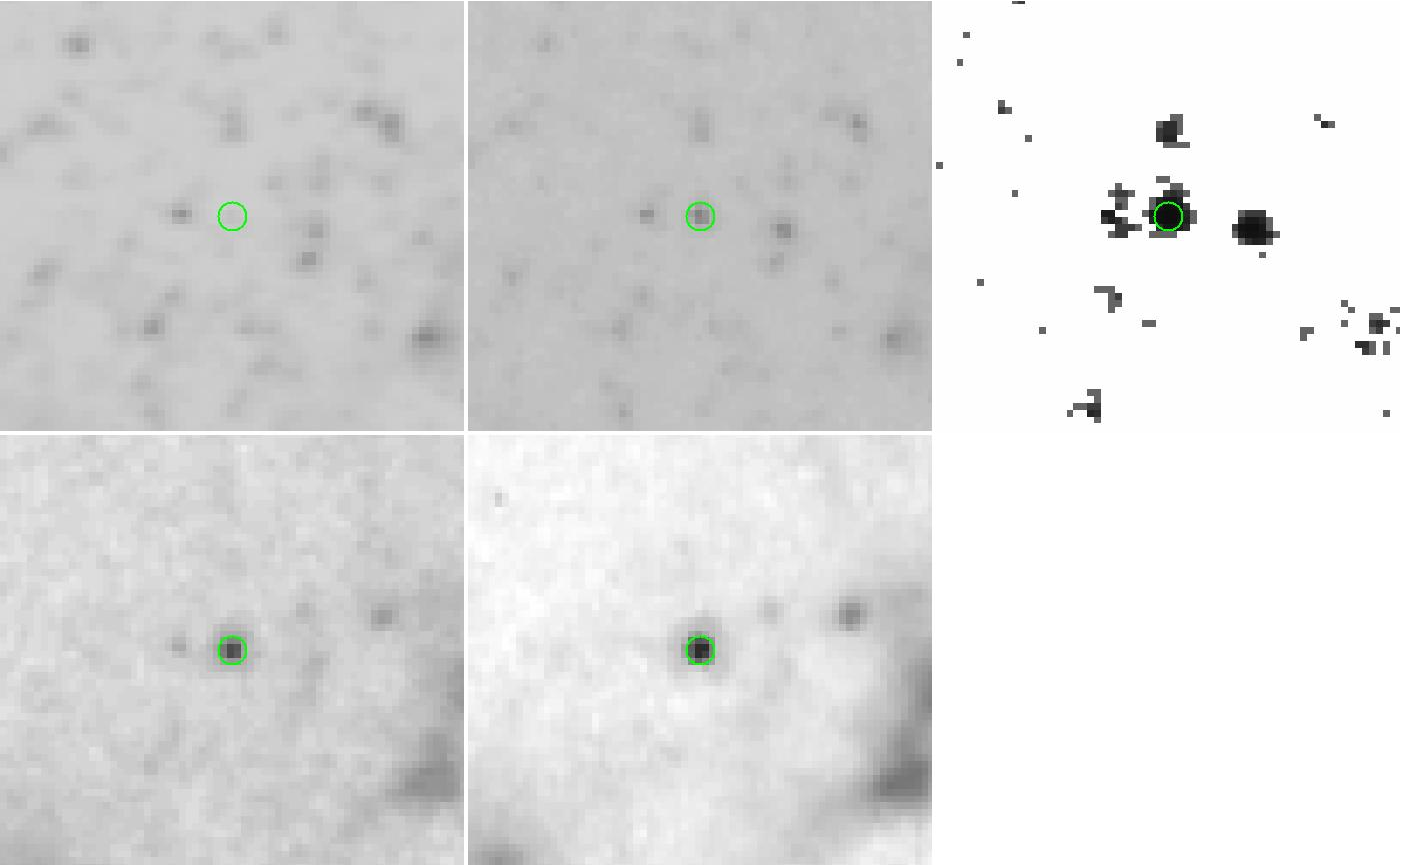
Fig.
8.— The NGC 300 transient progenitor is identified as a Class–A object
detected at both 3.6 μm (top left) and 4.5 μm (top center). The [3.6] −
[4.5] difference (top right), 5.8 μm (bottom left), and 8.0 μm (bottom
center) images are also shown. Each panel is ~60.0" on its sides.
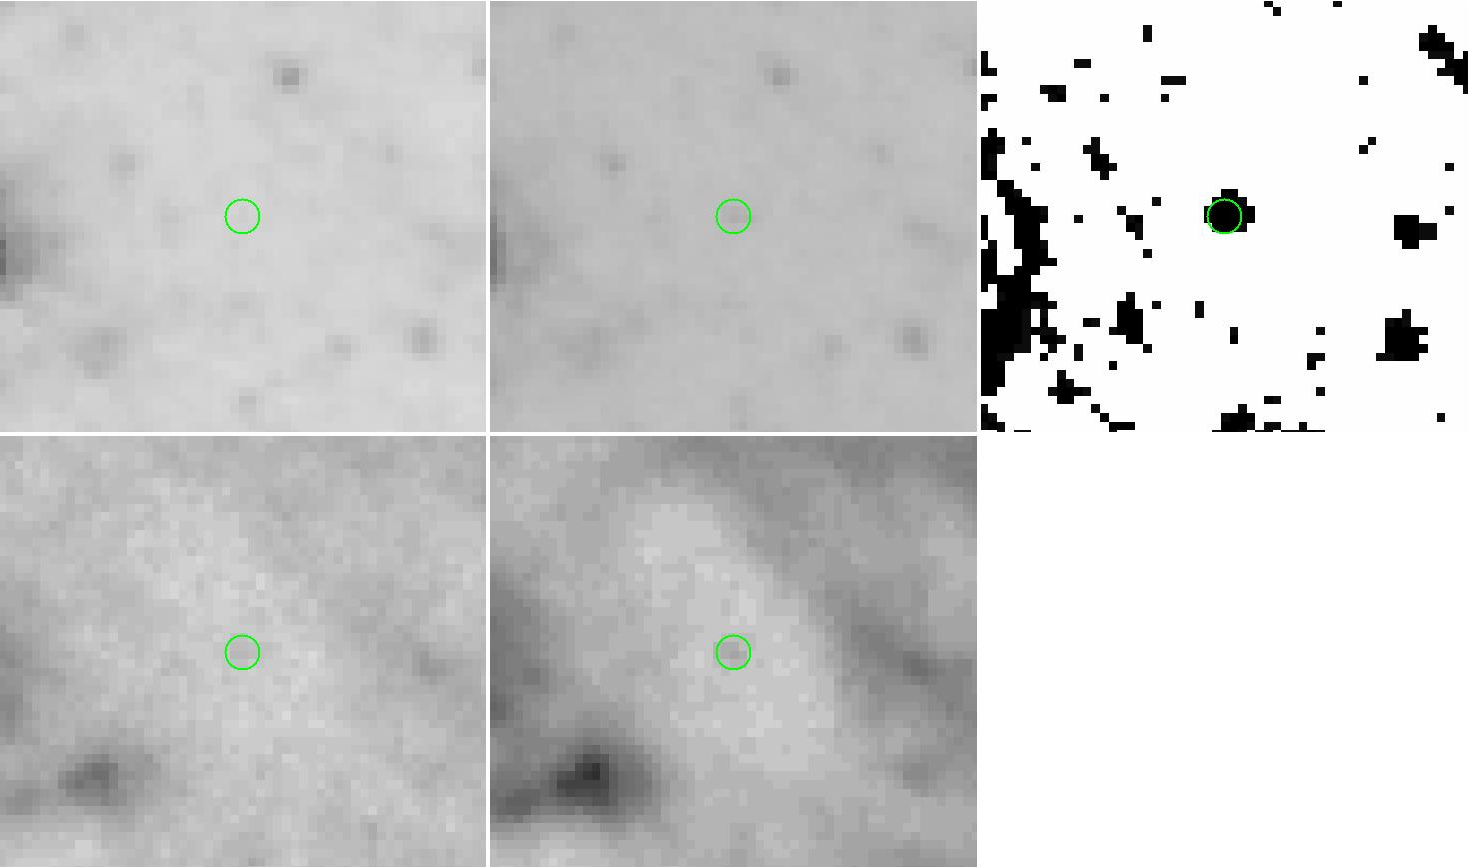
Fig.
9.— The SN 2008S progenitor, identified in NGC 6946 as a Class–B
object, is detected only at 4.5 μm (top center) but not at 3.6 μm (top
left ). The differenced image (top right) makes it clear that had we
missed it at 4.5 μm, it would be detected without any confusion as a
Class–C object. The 5.8 μm (bottom left ), and 8.0 μm (bottom center)
images are also shown. Each panel is ~41.3" on its sides.
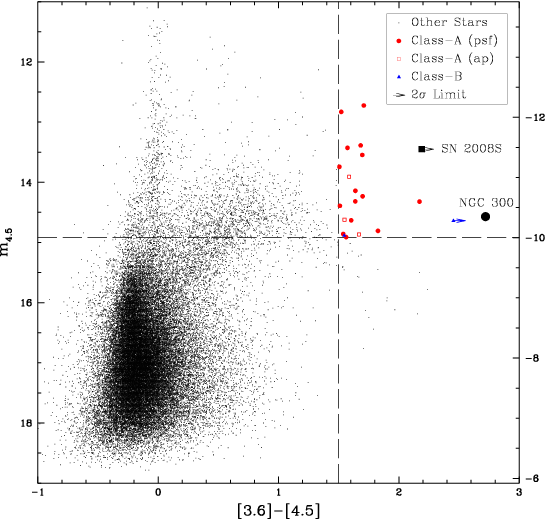
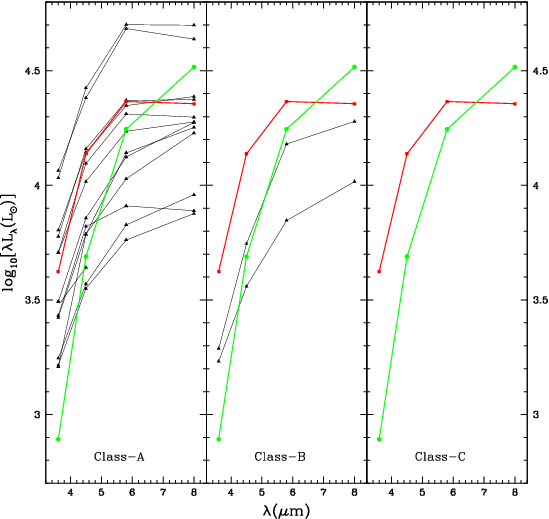
Fig.
10.— Mid-infrared color-magnitude diagram (left) and EAGB SEDs (right)
for M33. The apparent magnitude at 4.5 μm is plotted versus [3.6]−[4.5]
color for all sources detected in both 3.6 μm and 4.5 μm images through
PSF-photometry (black dots). For comparison, the positions of the
progenitors of NGC 300 (black circle) and SN 2008S (black square, lower
limit in color) are also shown (Prieto et al. (2008); Prieto (2008)),
and the 4.5 μm absolute magnitude scale is shown on the right. The
[3.6]−[4.5] > 1.5 and M4.5 < −10 selection for extremely
red and
bright objects, following the criteria used by Thompson et al. (2009),
is shown by the dashed lines. The EAGB candidates that meet these
criteria are shown with different symbols sorted according to the stage
of the search at which they were identified. The red circles and open
red squares indicate Class–A objects identified through PSF and
aperture-photometry, the blue triangles indicate Class–B objects, and
the green squares indicate Class–C objects (none in this case). Where
applicable, the lower limits in color are indicated with arrows. Stars
for which only m3.6 upper limits could be determined are not shown in
the SEDs panel. The SEDs of the SN 2008S (red) and NGC 300 (green)
progenitors are also shown. The 5.8 μm and 8.0 μm fluxes were
determined through aperture-photometry for the locations identified in
the 4.5 μm image. Due to significant PAH emission in these two bands,
we consider the aperture-photometry measurements in these bands less
reliable.
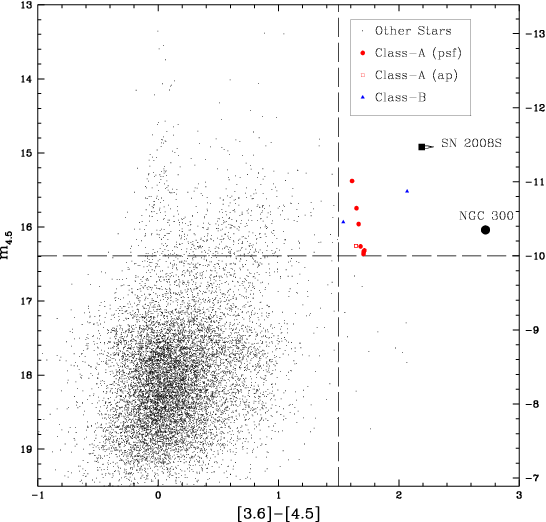
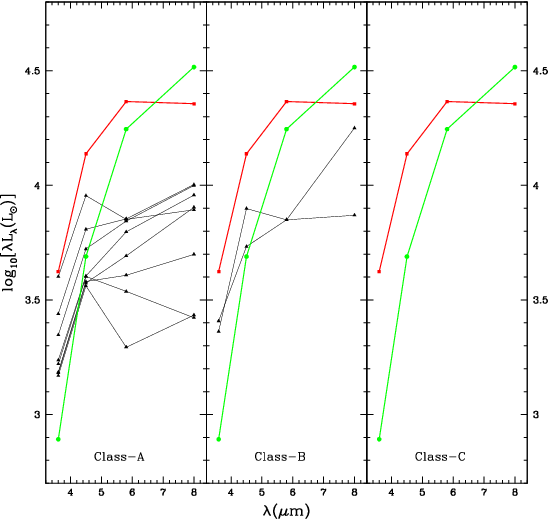
Fig.
11.— Mid-infrared color-magnitude diagram (left) and EAGB SEDs (right)
for NGC 300. Symbols and colors used here are the same as in Figure 10.
The SEDs of some fainter sources show a sharp decline at 5.8 μm before
rising again at 8.0 μm due to PAH dominated background contamination.
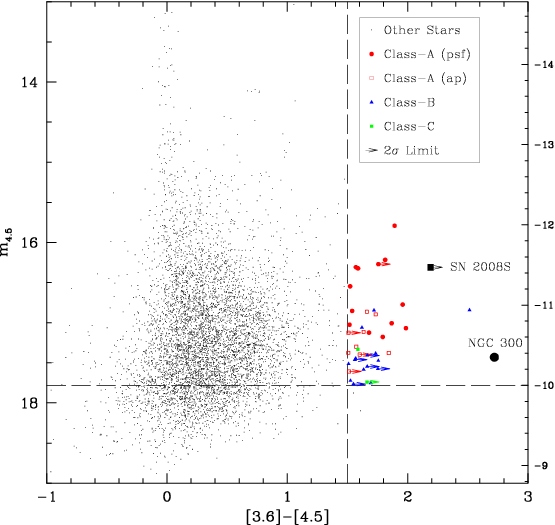
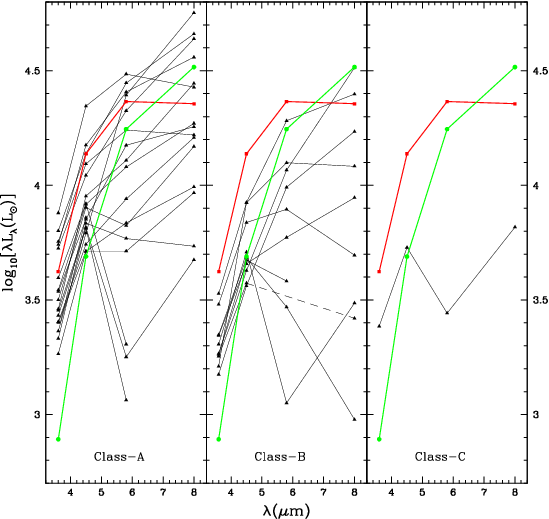
Fig. 12.— Mid-infrared color-magnitude
diagram (left) and EAGB SEDs (right) for M81. Symbols and colors used
here are the same as in Figure 10. The SEDs of some fainter sources
show a sharp decline at 5.8 μm before rising again at 8.0 μm due to PAH
dominated background contamination. Sources for which 5.8 μm and 8.0 μm
measurements could not be obtained at all due to contamination, only
the 3.6 μm and 4.5 μm measurements are shown on the SEDs. The dashed
line indicates an object for which only the 5.8 μm measurement could
not be obtained.
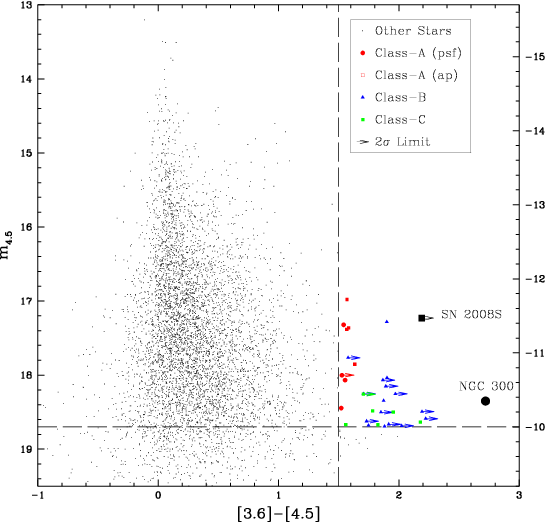
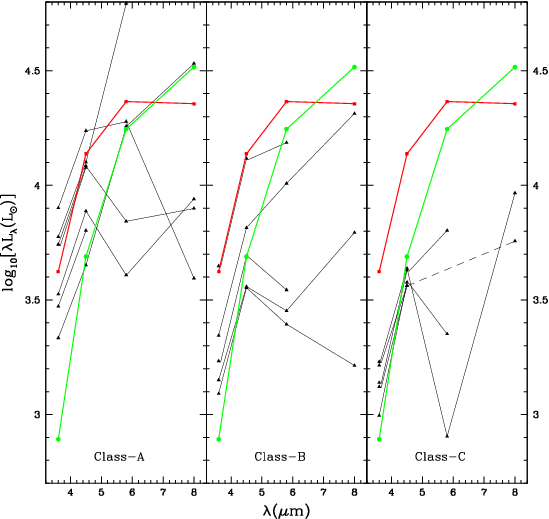
Fig. 13.— Mid-infrared color-magnitude
diagram (left) and EAGB SEDs (right) for NGC 6946. Symbols and colors
used here are the
same as in Figure 10. The SEDs of some fainter sources show a sharp
decline at 5.8 μm before rising again at 8.0 μm due to PAH dominated
background contamination. Sources for which 5.8 μm and 8.0 μm
measurements could not be obtained at all due to contamination, only
the 3.6 μm and 4.5 μm measurements are shown on the SEDs. The dashed
line indicates an object for which only the 5.8 μm measurement
could not be obtained.
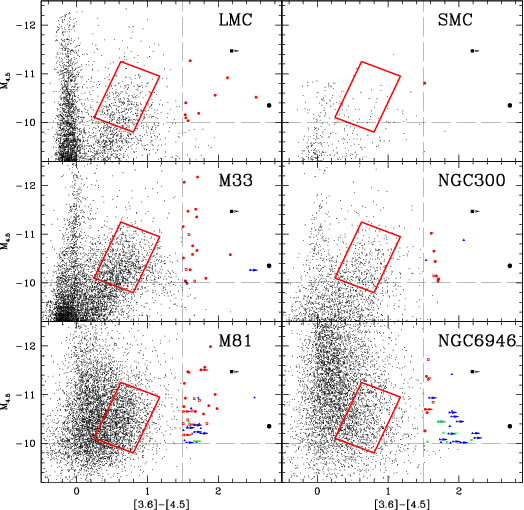
Fig. 14.— Mid-infrared color-magnitude
diagrams for the six galaxies. Symbols and colors used here are same as
in Figure 10, and the AGB region is shown in red. The small number of
bright objects in the SMC CMD is largely due to the SMC survey (Bolatto
et al. 2007) covering only portions of the SMC. The AGB regions of the
M81 and NGC 6946 CMDs contain significant extragalactic contamination.
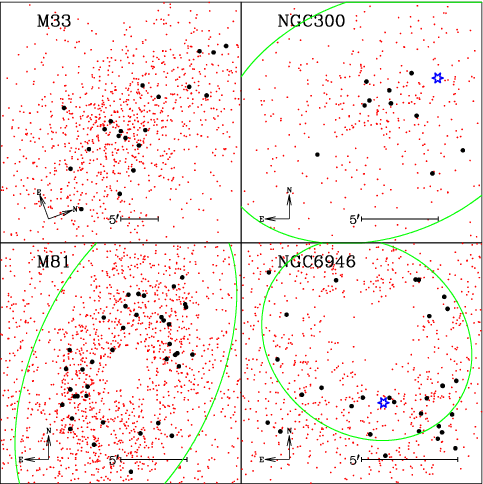
Fig. 15.— Distribution of AGB stars
(red dots) and EAGB stars (black filled circles), and the two 2008
transient locations (starred blue symbols) in the galaxies. The image
scales and directions are indicated in each panel, as well as the R25
ellipse (green). For M33, the R25 ellipse lies outside of our angular
selection region. The empty region at the center of M81 is due to the
image mask that we used for the brightest, nearly saturated, central
region of the galaxy. However, the notable absence of any AGB and EAGB
candidates towards the central region of NGC 6946 is not artificial, as
discussed in Section 3. We estimate that for NGC 300, M81, and NGC
6946, 90%, 70%, and 50% of our angular selection region is inside the
R25 ellipse (minus the M81 mask and the “empty” central region of NGC
6946). We use these sky area estimates when scaling the extragalactic
contamination from SDWFS.
Conclusions:
We carried out a systematic mid-IR photometric search for massive,
luminous, self-obscured stars in four nearby galaxies combined with
existing data for the LMC and SMC. We use a combination of conventional
PSF and aperturephotometry techniques along with an innovative
application of image subtraction. We investigate the population of SN
2008S-like transient event progenitor analogs in these 6 galaxies. We
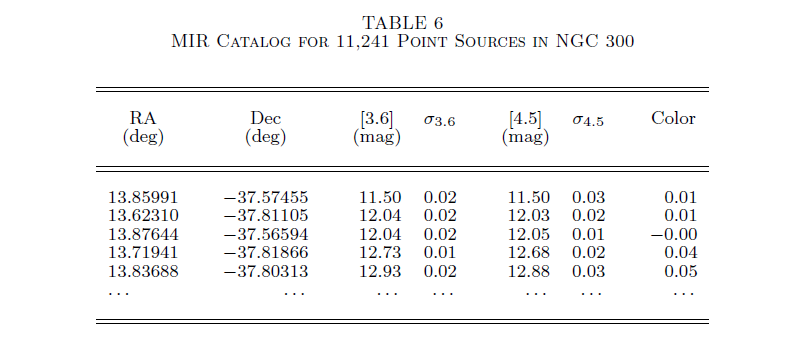
report catalogs of mid-IR sources in three new galaxies (NGC 300, M81,
and NGC 6946) and candidate extreme AGB stars in all 6.
Using our methods, bright and red extreme AGB stars can be
inventoried to D =<10 Mpc despite Spitzer’s relatively poor
angular resolution. The biggest current problem is that the archival
data is insufficiently deep: even with our innovative
“band-subtraction” technique, we simply need more photons to detect
these extremely red stars in the more distant galaxies. A future
multi-epoch survey using (warm) Spitzer could identify all EAGB
candidates in nearby galaxies, characterize their variability, and pin
down the contribution of these partly obscured stars to galaxy spectral
energy distributions as a function of wavelength.
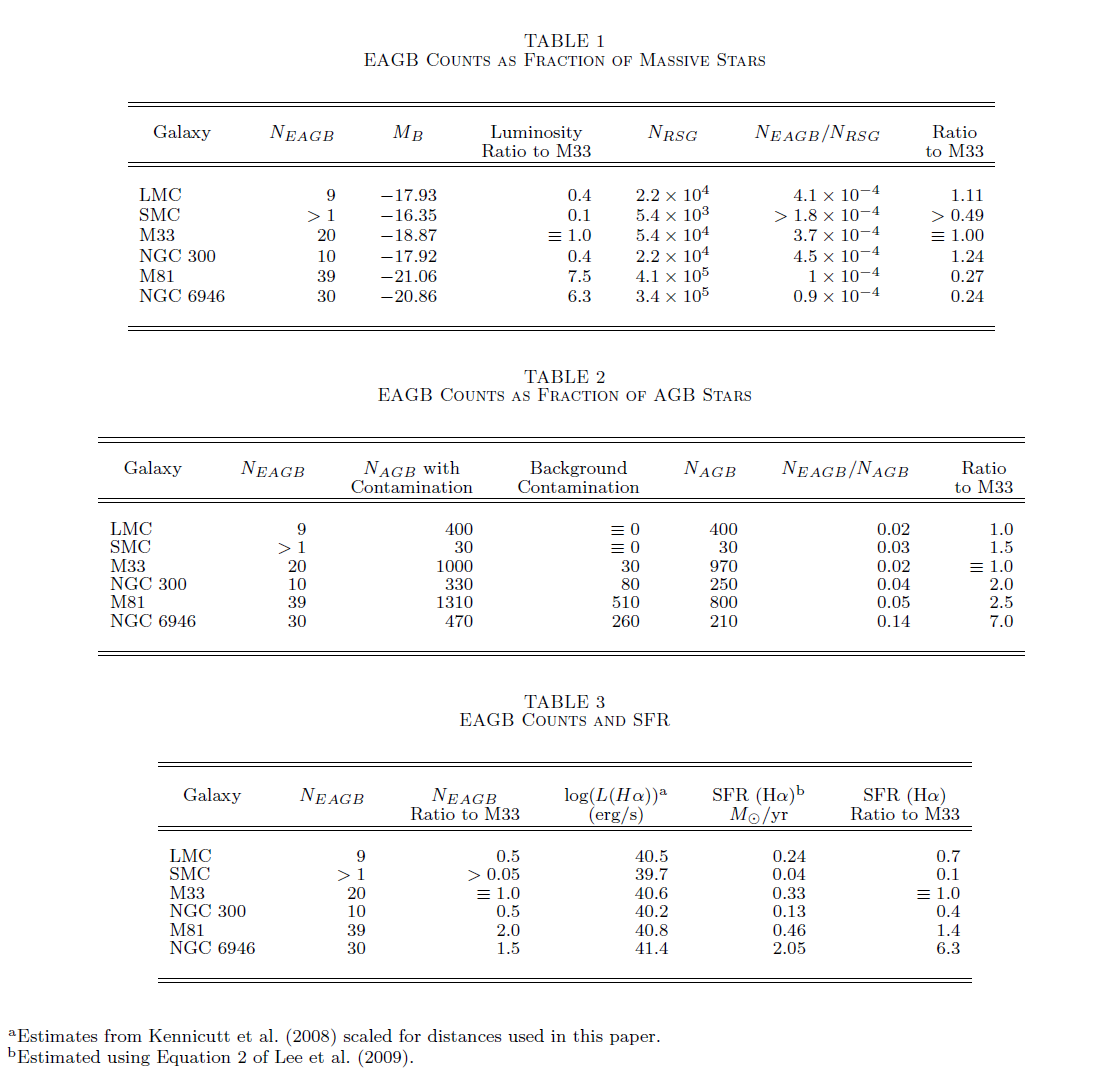
Finally, we again emphasize the point made by Thompson et al.
(2009). Stars analogous to the progenitors of the SN 2008S and the NGC
300 transients are truly rare in all galaxies. At any moment there
appears to be only ~1 true analog, and up to ~10 given a more liberal
selection criterion, per galaxy. While completeness problems due to the
limited depth of the archival data make it impossible to give exact
scalings, they represent roughly 2E−4 of the red super giant
population, ~1E−2 of the AGB population, and appear at a rate of order
50 EAGB stars per unit star formation (solar mass per year) using the
liberal criteria (and an order of magnitude fewer if we use the more
conservative one). Clarifying these scalings with stellar mass, star
formation rate and metallicity requires larger and deeper surveys of
nearby galaxies than can be accomplished with warm Spitzer or
eventually with JWST.
Acknowledgements:
We thank Szymon Kozlowski for helping us estimate extragalactic
contamination using the SDWFS data and Janice Lee for helpful
discussions. We extend our gratitude to the SINGS Legacy Survey and LVL
Survey for making their data publicly available. This research has made
use of NED, which is operated by the JPL and Caltech, under contract
with NASA and the HEASARC Online Service, provided by NASA’s GSFC. RK
and KZS are supported in part by NSF grant AST-0707982. JLP
acknowledges support from NASA through Hubble Fellowship grant
HF-51261.01-A awarded by the STScI, which is operated by AURA, Inc. for
NASA, under contract NAS 5-26555. KZS, CSK and TAT are supported in
part by NSF grant AST-0908816. TAT is supported in part by an Alfred P.
Sloan Foundation Fellowship. JFB is supported by NSF CAREER grant
PHY-0547102.