Pre-discovery and Follow-up Observations of the Nearby SN 2009nr:
Implications for Prompt Type Ia SNe
Rubab Khan, J. L. Prieto, G. Pojmanski, K. Z. Stanek, J. F. Beacom, D. M. Szczygiel, B. Pilecki, K. Mogren, J. D. Eastman, P. Martini, R. Stoll
Abstract:
We
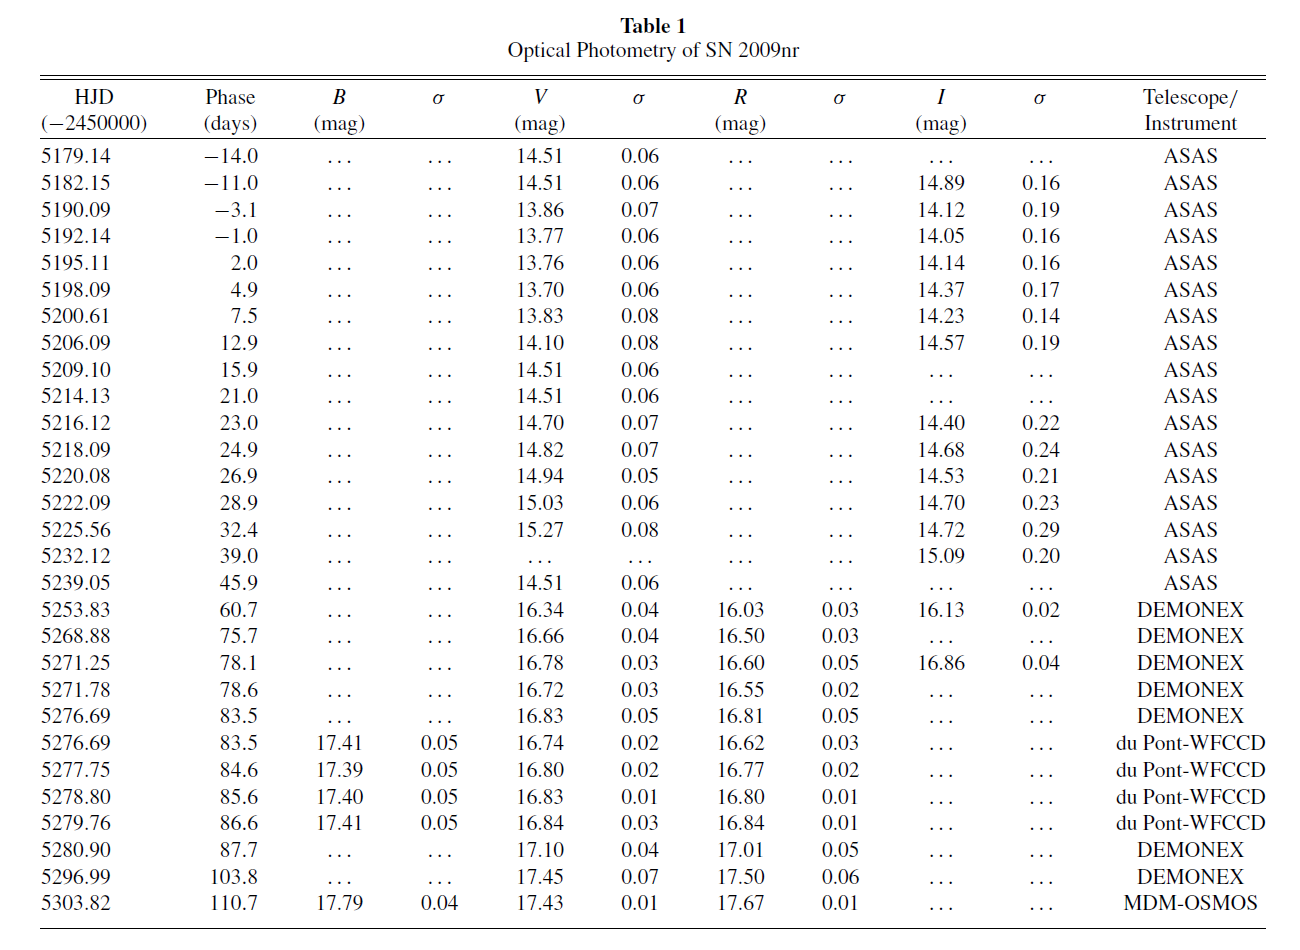
present photometric and spectroscopic observations of the Type Ia
supernova SN 2009nr in UGC 8255 (z=0.0122). Following the discovery
announcement at what turned out to be ten days after peak, we detected
it at V ~15.7 mag in data collected by the All Sky Automated Survey
(ASAS) North telescope 2 weeks prior to the peak, and then followed it
up with telescopes ranging in aperture from 10-cm to 6.5-m. Using early
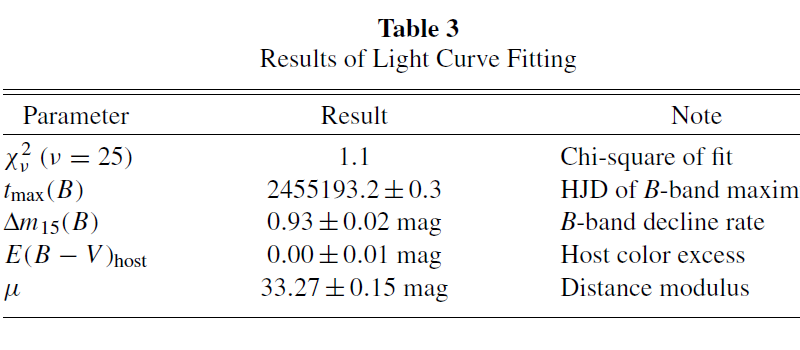
photometric data available only from ASAS, we find that the SN is
similar to the over-luminous Type Ia SN 1991T, with a peak at Mv=-19.6
mag, and a slow decline rate of Dm_15(B)=0.95 mag. The early
post-maximum spectra closely resemble those of SN 1991T, while the late
time spectra are more similar to those of normal Type Ia SNe.
Interestingly, SN 2009nr has a projected distance of 13.0 kpc (~4.3
disk scale lengths) from the nucleus of the small star-forming host
galaxy UGC 8255. This indicates that the progenitor of SN 2009nr is not
associated with a young stellar population, calling into question the
conventional association of luminous SNe Ia with the ``prompt''
component directly correlated with current star formation. The
pre-discovery observation of SN 2009nr using ASAS demonstrates the
science utility of high cadence all sky surveys conducted using small
telescopes for the discovery of nearby (d=<50 Mpc) supernovae.
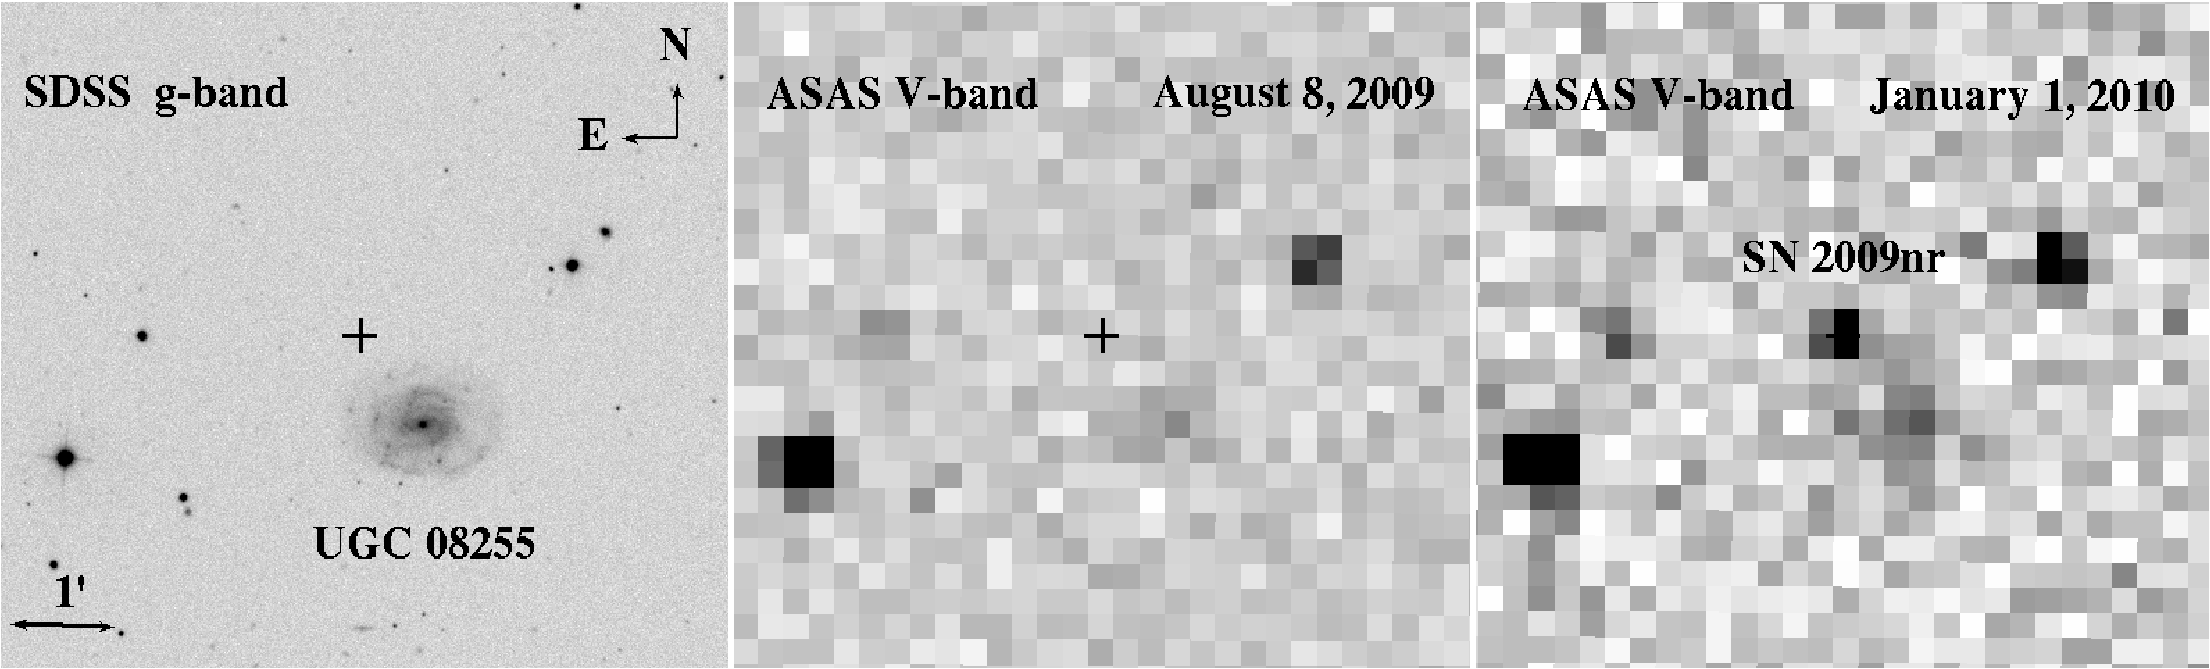
Fig.
1.— SDSS g-band image of the SN 2009nr host galaxy UGC 8255 (left) and
ASAS V-band images of the same field taken prior to (center) and after
(right)the explosion. Each image has the same orientation and shows the
same region. The location of SN 2009nr is marked with a cross.
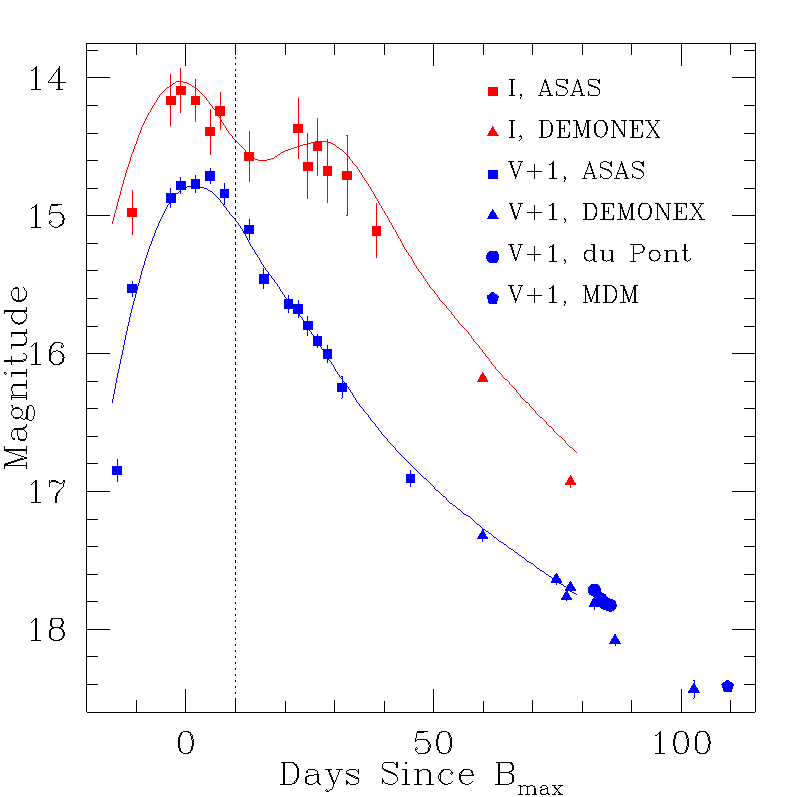
Fig.
2.— V- and I-band light curves of SN 2009nr. The horizontal axis is in
days from the date of maximum brightness in the B band. The two solid
lines are SN Ia light curve template fits to the ASAS data points only.
The dotted line shows the epoch of the discovery announcement (∼10 days
after Bmax). TheV-band light curve is shifted by +1 mag for clarity.

Fig.
3.— Comparison of V-band light curve of SN 2009nr with those of the
overluminous Type Ia SN 1991T (Lira et al. 1998), the normal Type Ia SN
2003du (Stanishev et al. 2007), and the possibly super-Chandrasekhar
mass Type Ia SN 2009dc (Silverman et al. 2010). The black solid line is
the SN Ia light curve template fit to the ASAS data points only. The
light curves of the comparison SNe are shifted so that their peaks
approximately match that ofSN 2009nr.
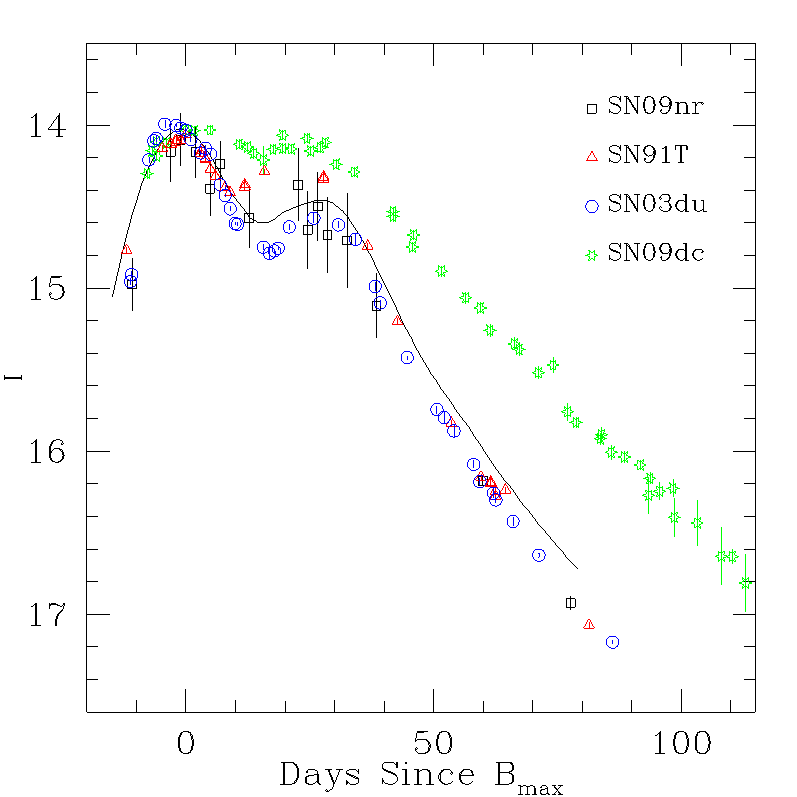
Fig. 4.— Same as Figure 3, but for I band.

Fig.
5.— Color evolution of SN 2009nr (black data points) compared to those
of the overluminous Type Ia SN 1991T (red; Lira et al. 1998), the
normal Type Ia SN 2003du (blue; Stanishev et al. 2007), and the
possibly super-Chandrasekhar Type Ia SN 2009dc (green; Silverman et al.
2010). The horizontal axis is same as in Figure 2. The continuous lines
are connected colorevolution data points of the respective SNe.
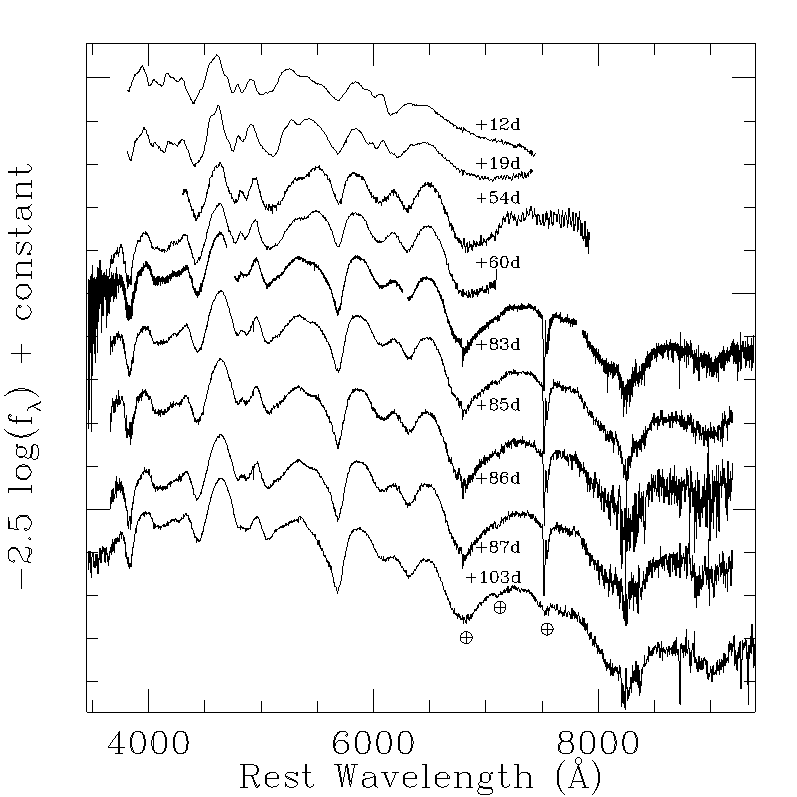
Fig.
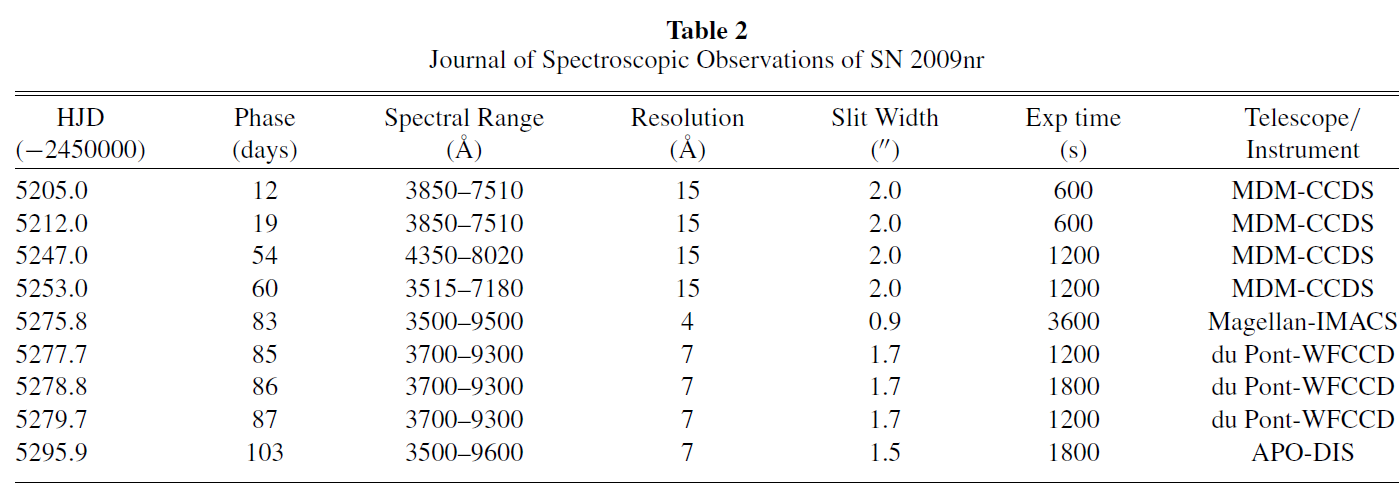
6.— Spectral evolution of SN 2009nr. Epochs are in days since the date
of maximum brightness in the B band. The vertical displacements are
arbitrary.The telluric lines at 6800 \C5, 7200 \C5, and 7600 \C5 are labeled.
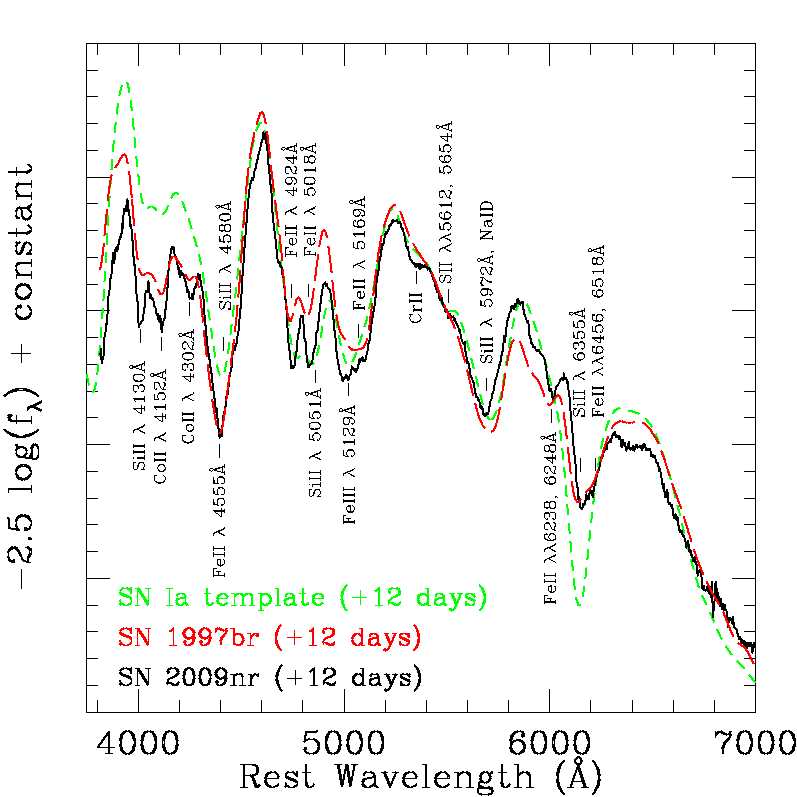
Fig.
7.— Comparison of the earliest SN 2009nr spectrum (black continuous
line) and the spectrum of SN 1991T like supernova SN 1997br (red long
dashed line, dereddened by E(B − V ) = 0.35 mag; Li et al. 1999), both
collected 12 days after the date of maximum brightness in the B band,
with a normal SN Ia spectrum template for the same post-maximum epoch
(green short-dashed line; Hsiao et al. 2007). All the spectra are
corrected to the rest frame and shiftedso that their flux approximately match at 5500 \C5.
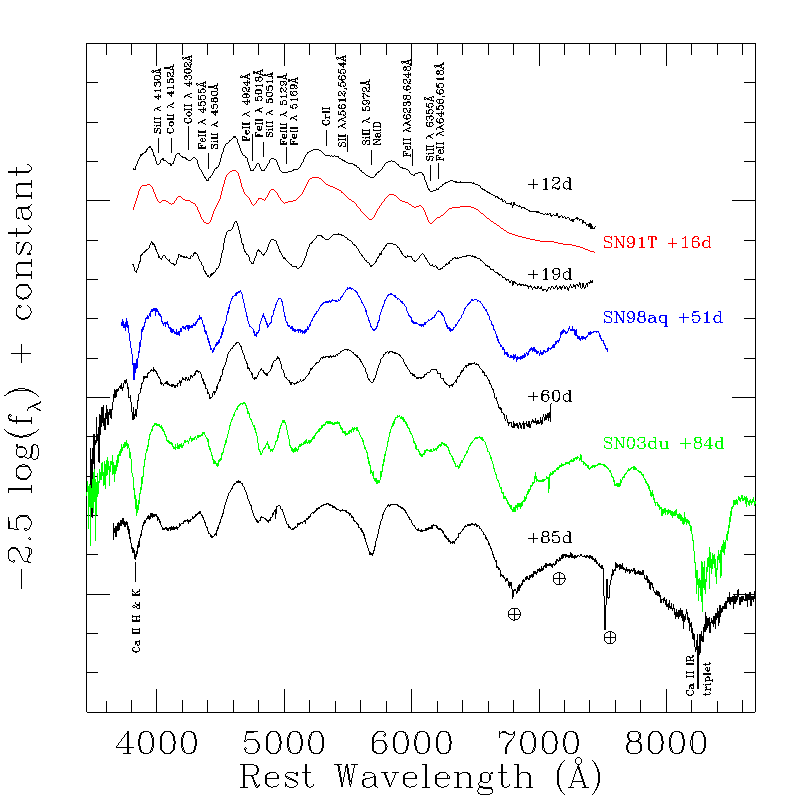
Fig.
8.— Spectral evolution of SN 2009nr as compared to spectroscopically
similar SNe at the relevant phase as determined by SNID (Blondin &
Tonry 2007). Important features are labeled along with the telluric
lines (6800 \C5, 7200 \C5, and 7600 \C5). The data for SN 1991T, SN 1998aq,
and SN 2003du are from Mazzali et al. (1995), Branch et al. (2003), and
Stanishev et al. (2007), respectively. All the spectra are corrected to
the rest frame using
the redshifts (zhelio) of the hosts. The SN 1991T spectra is dereddened
by E(B − V ) = 0.13 mag (Li et al. 1999; Saha et al. 2001). Host
extinction for SN 1998aq (Reindl et al. 2005), SN 2003du (Stanishev et
al. 2007), and SN 2009nr (Section 3.1) are consistent with zero.
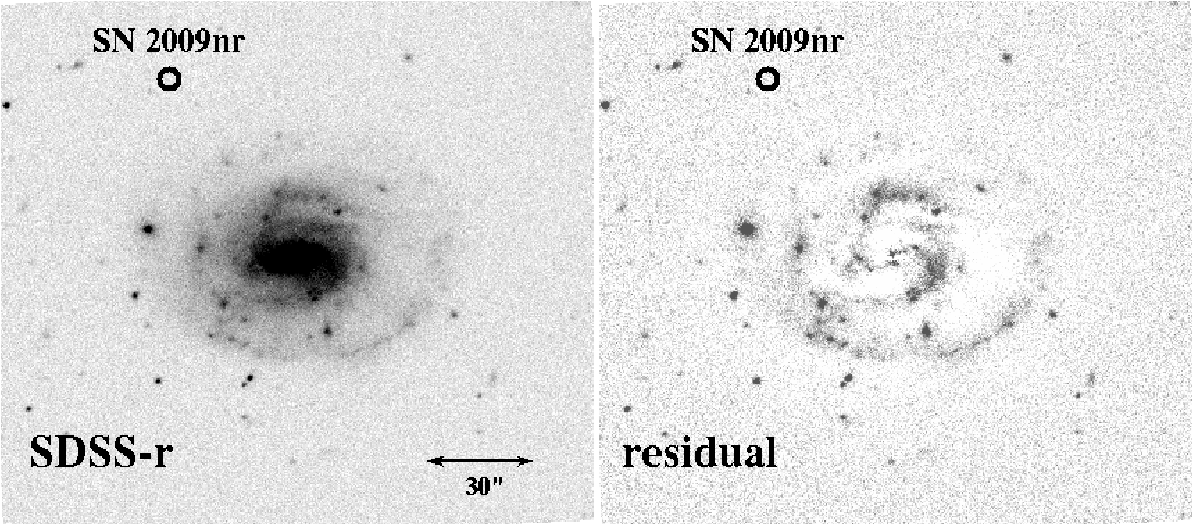
Fig.
9.— SDSS r-band image of the SN 2009nr host galaxy UGC 8255 (left) and
the residuals after subtracting a simple GALFIT (Peng et al. 2002)
profile using abulge/disk decomposition (Sersic and exponential disk
profiles). The location of SN 2009nr is marked with a circle.
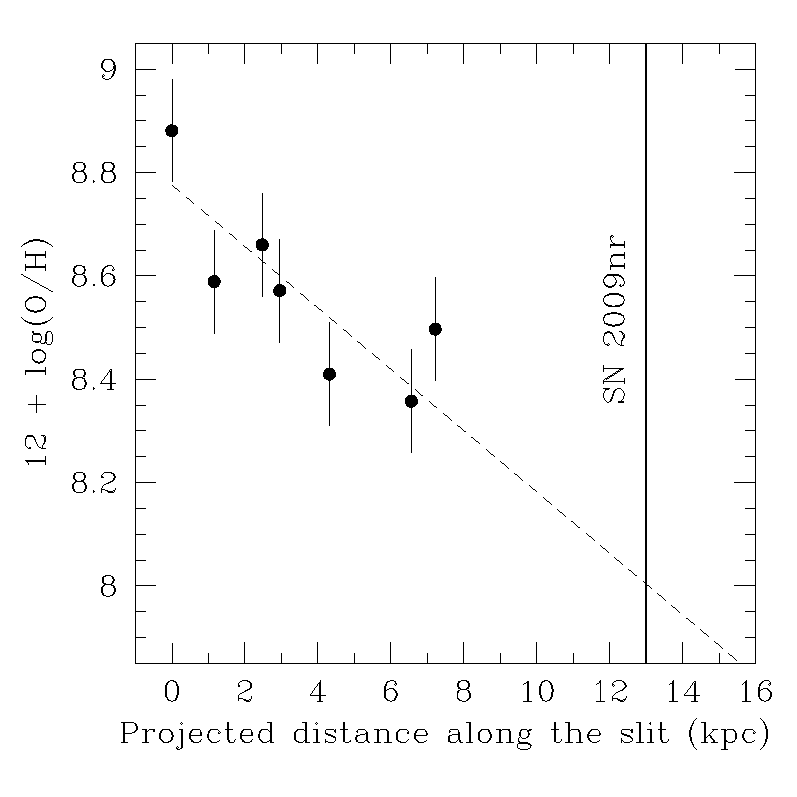
Fig.
10.— Radial oxygen abundance profile of the SN 2009nr host galaxy UGC
8255 along a slit going through the SN and the center of the host
(based on six off-center Hii regions). The oxygen abundance is
calculated using the [N ii]/ Hα ratio. The dashed line shows a linear
fit to the oxygen abundance measurements and has a gradient of∼0.06 dex
kpc−1. The solid linemarks the position ofthe SN.
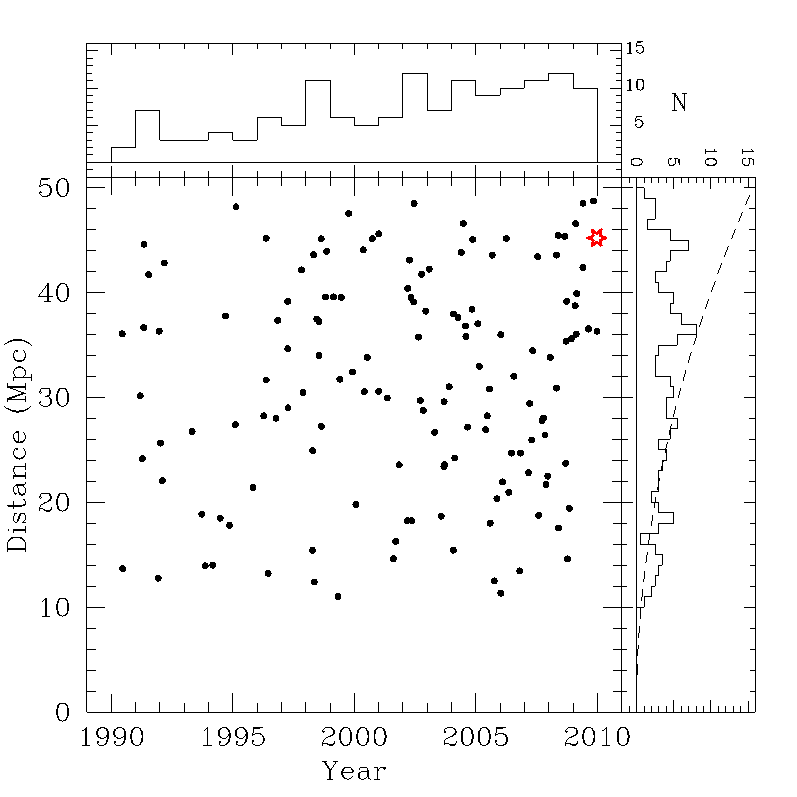
Fig.
11.— History of Type Ia SNe discovery within d~50 Mpc over the past 20
years according to the Sternberg Astronomical Institute SN Catalogue
(Bartunov et al. 2007). SN 2009nr is shown with a red starred symbol.
The histograms show projections on the respective axes. The dashed line
in the histogram to the right indicates the z = 0 extrapolation of the
cosmic SN Ia rate density (Horiuchi & Beacom 2010) for this local
volume. (The distances were obtained assuming the Hubble flow. Because
of the importance of SN Ia at the closest distances, two objects
apparently within 10 Mpc were examined separately and found to have
distance estimates in the literature beyond 10 Mpc, and were corrected.
See Horiuchi & Beacom (2010) for further discussion onnearby SN Ia rates.)
Conclusions:
SN 2009nr is a SN
1991T-like supernova that is more luminous and has a slower initial
decline rate than normal Type Ia SNe. Located ~4.3 disk scale lengths
away from the nucleus of its star-forming host, it either formed in the
halo or wandered out over a long time. Evidently, it is not associated
with the young stellar population and central star forming environment
of its host.
In fact, many bright and slow SNe Ia occurring in star-forming hosts
are not associated with young stellar populations, and thus should not
be considered a part of the prompt Ia population by default. Type Ia
SNe that are located far from their host galaxy nucleus probably have
no association with the recent star forming history of that galaxy.
This may affect attempts to explore causal connections between SNe Ia
and their host properties.
Scientifically interesting SNe, of both Type I and II, have often been
discovered in low metallicity, low luminosity galaxies that are usually
not targeted in SN surveys. Galaxy-impartial high cadence all sky
searches conducted using small telescopes such as ASAS can produce a
galaxy independent SN sample and lead to pre-maximum detection of many
local (d<~50 Mpc) SNe.
Acknowledgements:
We thank the referee, Xiangcun Meng, and Andrew Drake for helpful
comments, C.~S.~Kochanek for helpful comments and discussions, and M.
Kriek for making her SPS code publicly available. We are grateful to
the staffs of the Las Campanas Observatory, the Apache Point
Observatory, the MDM Observatory, and the Winer Observatory for their
excellent support. This research has made use of NED, which is operated
by the JPL and Caltech, under contract with NASA and the HEASARC Online
Service, provided by NASA's GSFC. RK and KZS are supported in part by
NSF grant AST-0707982. JLP acknowledges support from NASA through
Hubble Fellowship grant HF-51261.01-A awarded by the STScI, which is
operated by AURA, Inc. for NASA, under contract NAS 5-26555. GP and BP
are supported by the Polish MNiSW grant N203 007 31/1328. KZS and DMS
are supported in part by NSF grant AST-0908816. JFB is supported by NSF
CAREER grant PHY-0547102.