Object-X:
The Brightest Mid-IR Point Source in M33
Rubab Khan, K. Z. Stanek, C. S. Kochanek, A. Z. Bonanos
Abstract:
We
discuss the nature of the brightest mid-IR point source (which we dub
Object X) in the nearby galaxy M33. Although multi-wavelength data on
this object have existed in the literature for some time, it has not
previously been recognized as the most luminous mid-IR object in M33
because it is entirely unremarkable in both optical and near-IR light.
In the Local Group Galaxies
Survey, Object X is a faint red source visible in VRI and H-alpha but
not U or B. It was easily seen at JHK_s in the 2MASS survey. It is the
brightest point source in all four Spitzer IRAC bands and is also
visible in the MIPS 24-micron band. Its bolometric luminosity is 5x10^5
L_sun. The source is optically variable on short time scales (tens of
days) and is also slightly variable in the mid-IR, indicating that it
is a star. Archival photographic plates (from 1949 and 1991) show no
optical source, so the star has been obscured for at least half a
century. Its properties are similar to those of the Galactic OH/IR star
IRC+10420 which has a complex dusty circumstellar structure resulting
from episodic low velocity mass ejections. We propose that Object X is
a M>30 M_sun evolved star obscured in its own dust ejected during
episodic mass loss events over at least half a century. It may emerge
from its current ultra-short evolutionary phase as a hotter post-RSG
star analogous to M33 Var A. The existence and rarity of such objects
can be an important probe of a very brief yet eventful stellar
evolutionary phase.
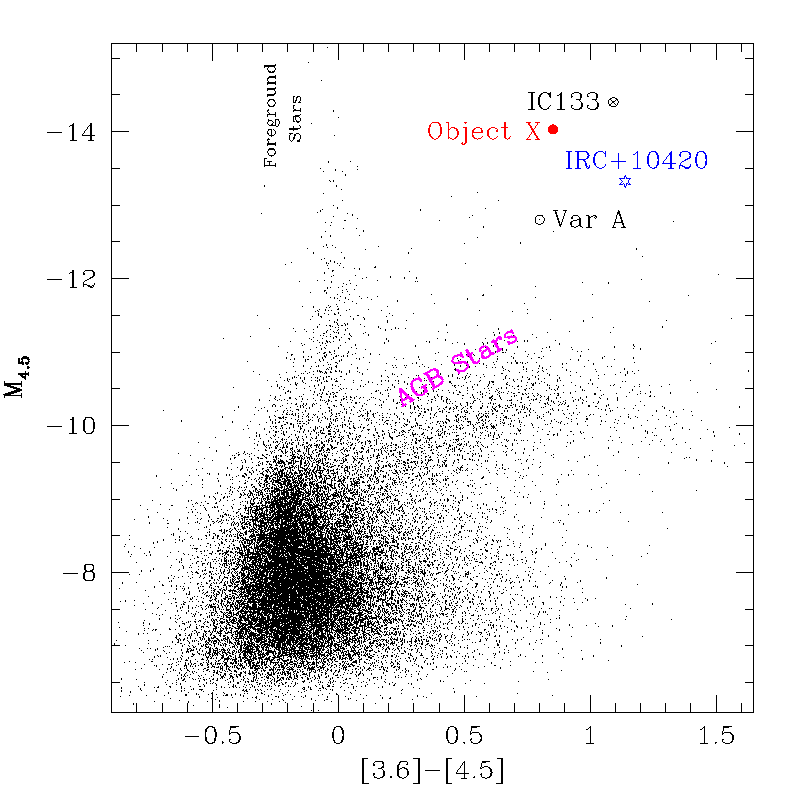
Fig. 1.— The 4.5 um absolute magnitude and the [3:6]
- [4:5] color mid-IR CMD of M33adopted from Thompson et al. (2009).
Object X (red circle), the star cluster IC133 (crossand circle) and Var
A (open circle around dots) are marked. For comparison, we also showthe
position of IRC+10420 (blue starred symbol) for a 5 kpc distance (Jones
et al. 1993).The extremely bright stars near color ~0 are the
foreground stars and the stars on the redbranch at M_4.5 = -10:5 are
M33 AGB stars. There are no other stars in M33 that are evenremotely
similar to Object X in these bands.
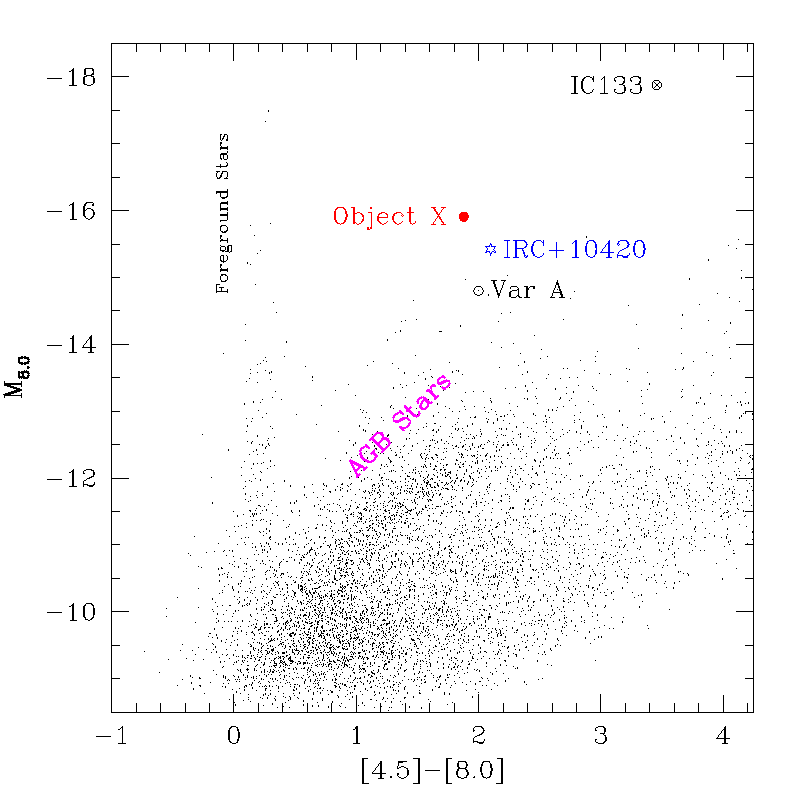
Fig. 2.— Same as Figure 1 but for 8.0 um absolute
magnitude and the [4:5] - [8:0] color. Object X stands out in this
combination of mid-IR bands as well.
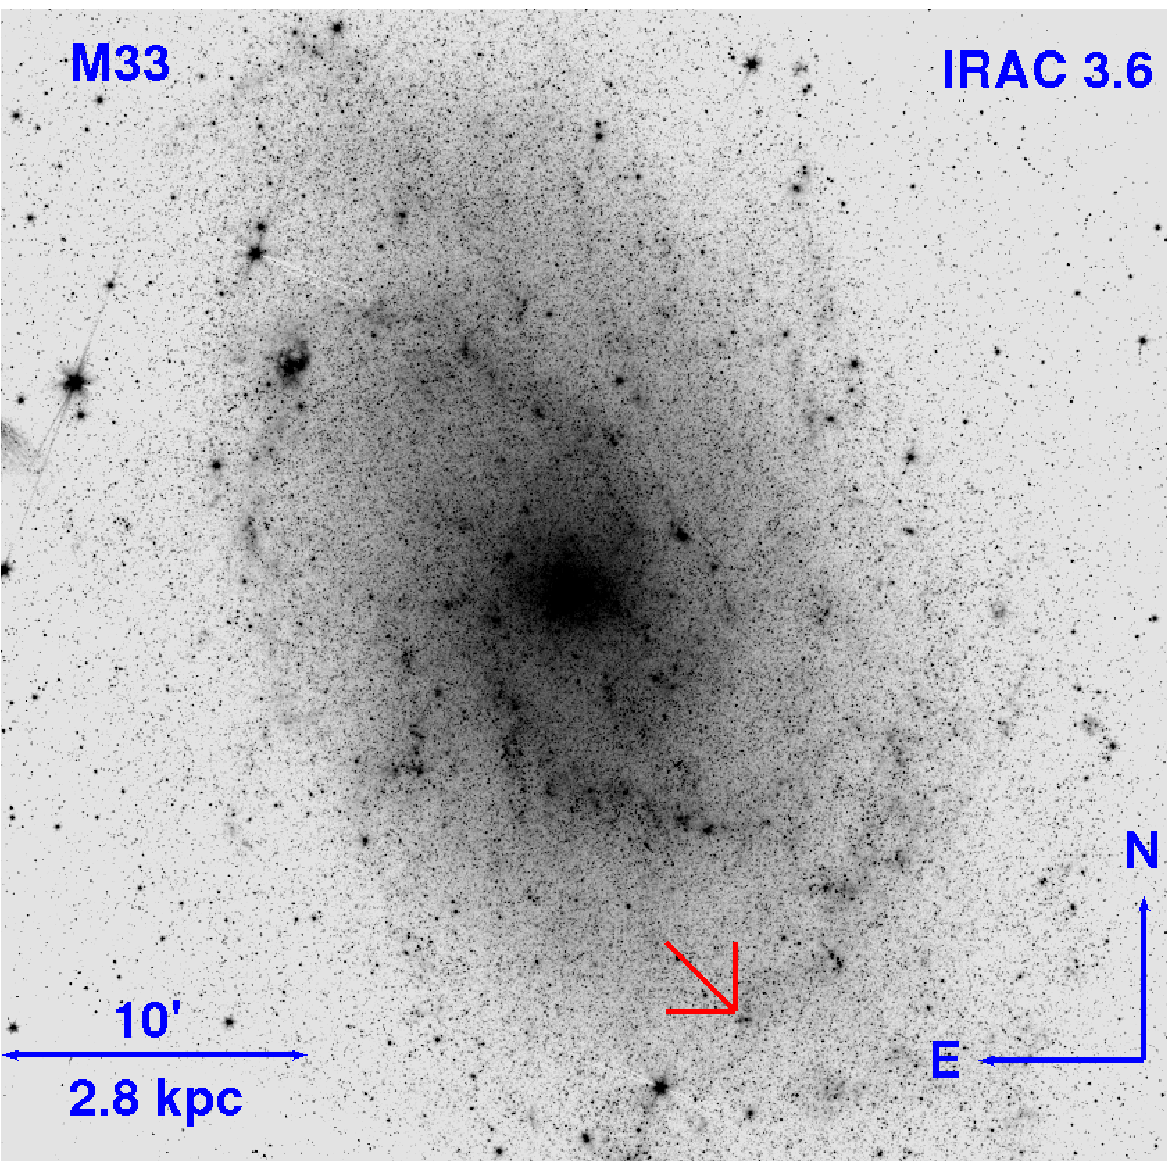
Fig. 3.— The IRAC 3.6 um image of M33 showing the location of Object X with an arrow.
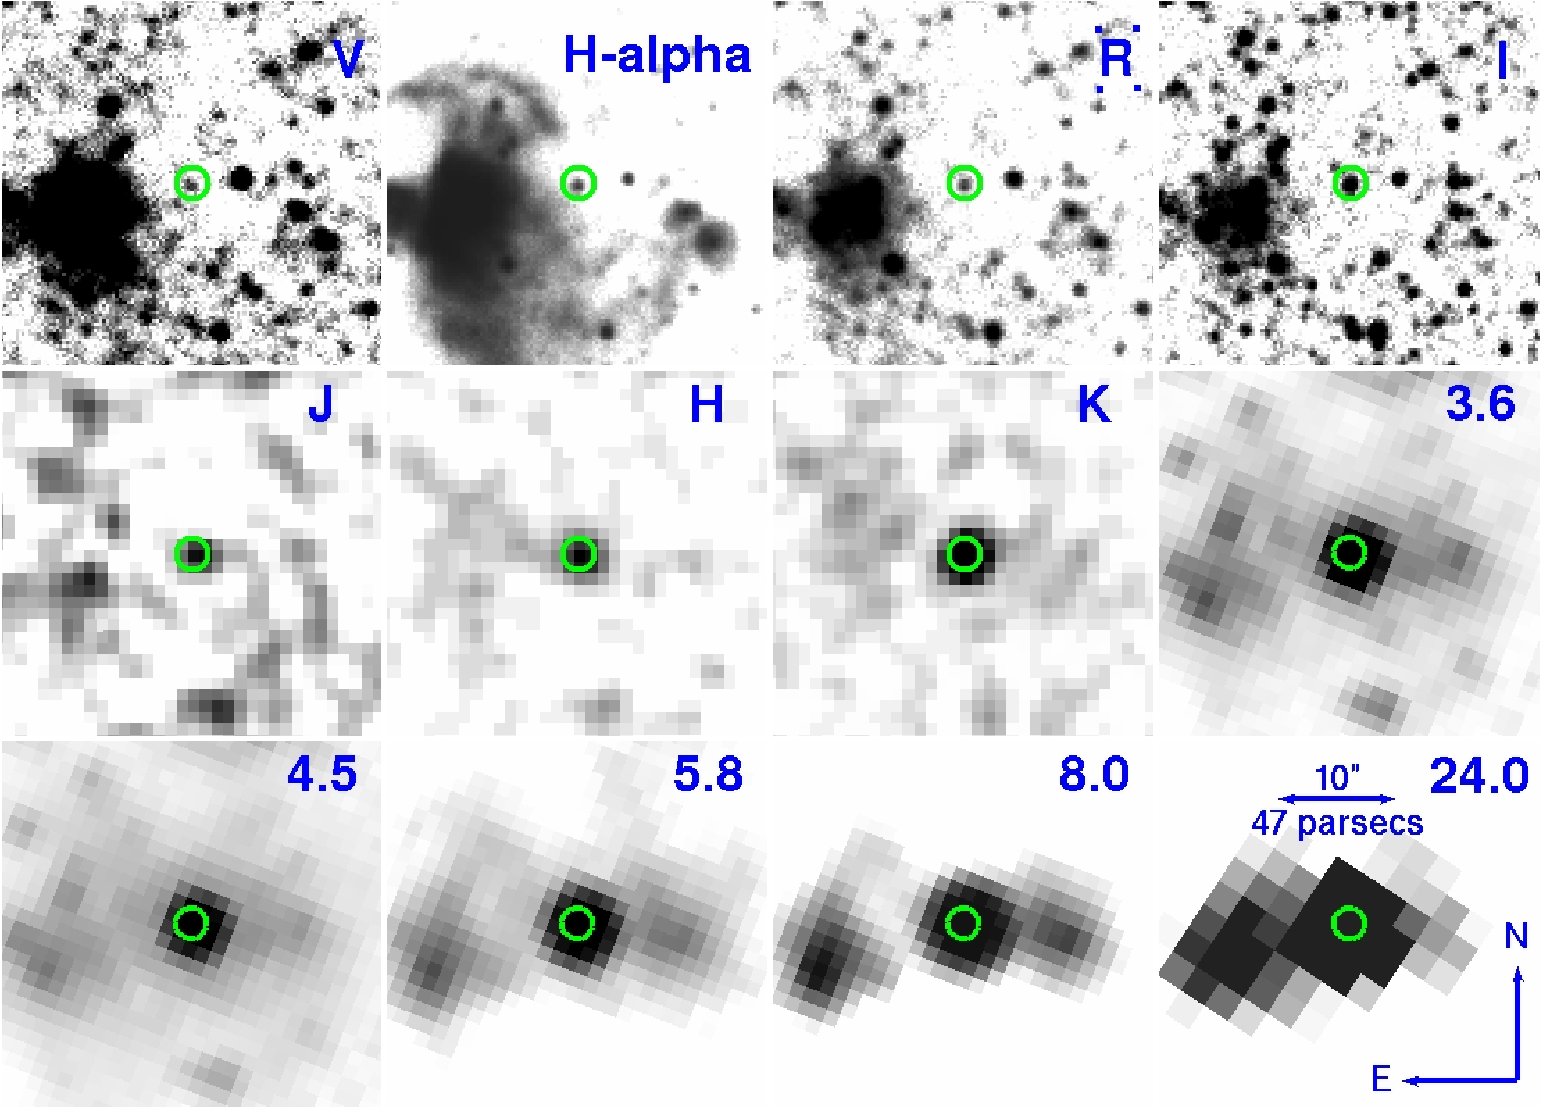
Fig.
4.— Multi-band images of the region around Object X (marked by the
circles). Theoptical images were taken from the Local Group Survey
(Massey et al. 2006), the near-IRimages were taken from 2MASS
(Skrutskie et al. 2006), the mid-IR images are from sixco-added epochs
of the data from McQuinn et al. (2007) as processed by Thompson et
al.(2009), and the MIPS 24 um band image is from the Spitzer archive.
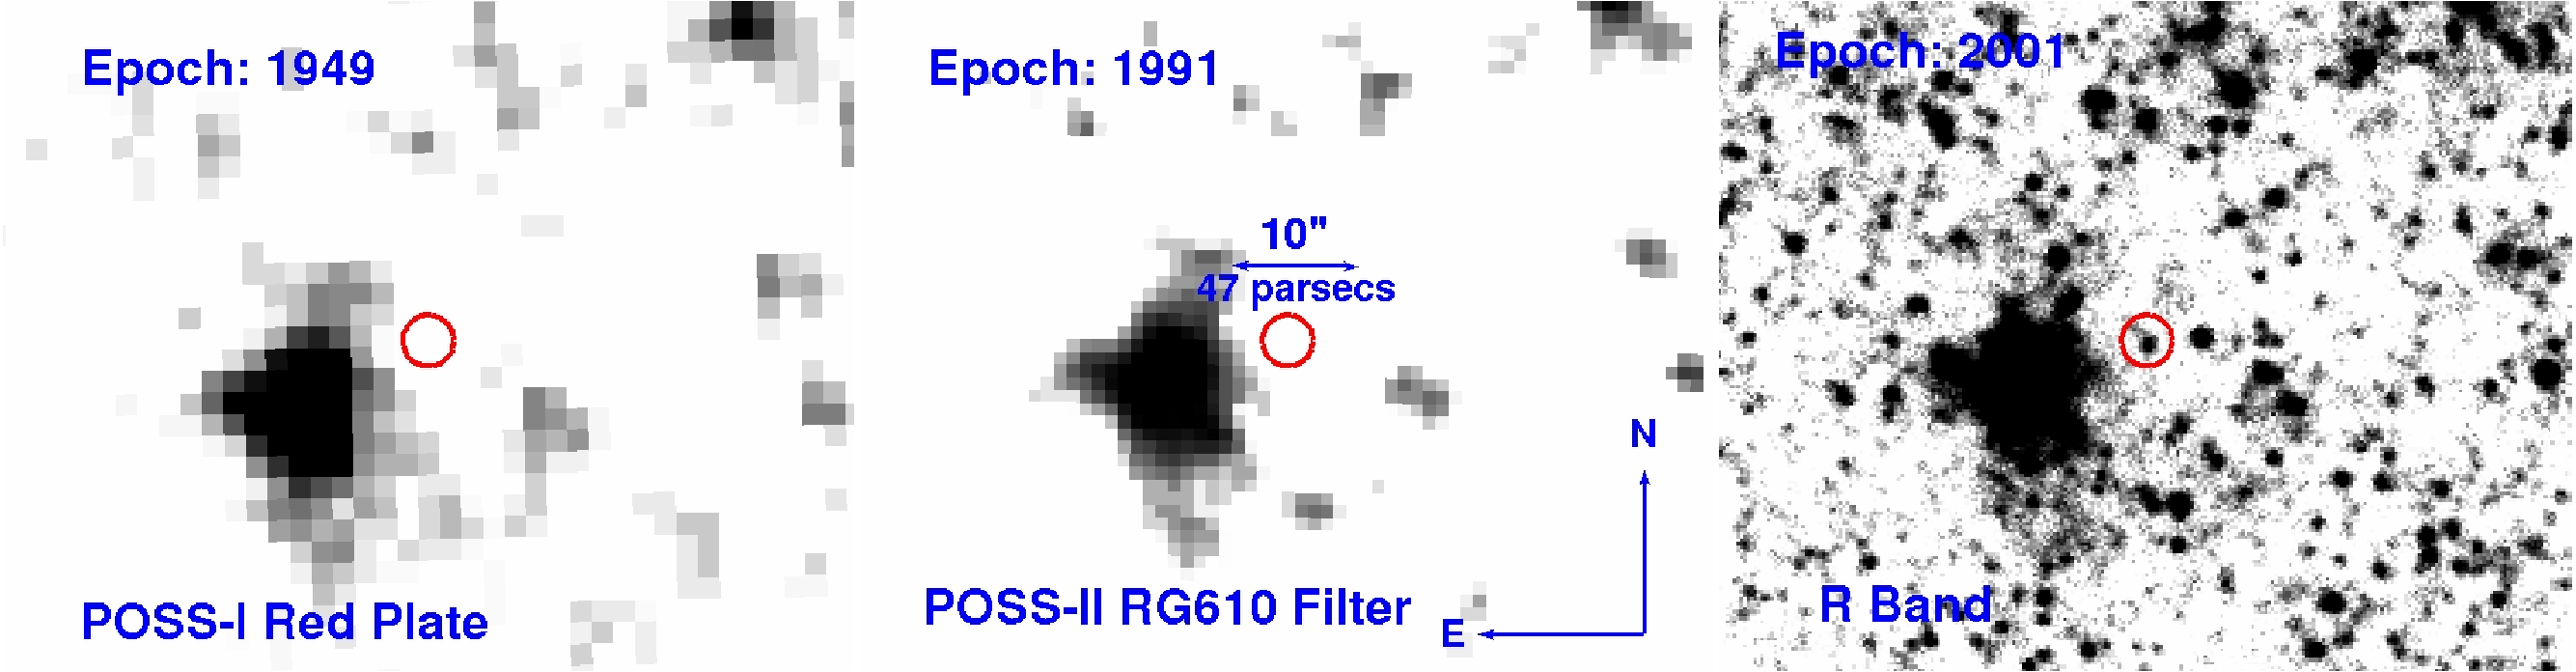
Fig.
5.— Historical images of the region near the location of Object X
(marked by the circles) over the last ~60 years implying that Object X
has remained obscured at least over this period of time.
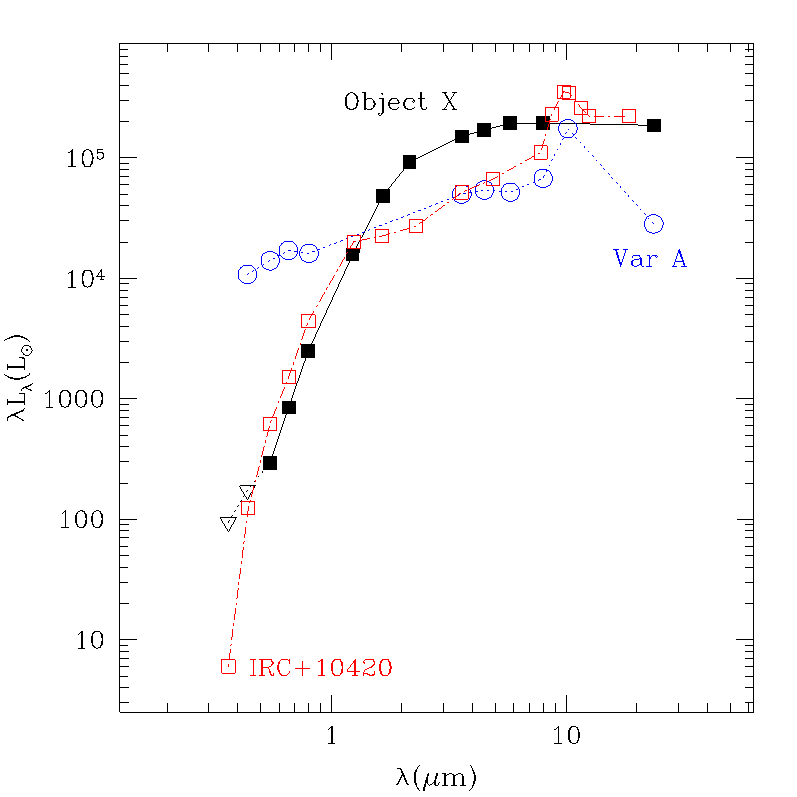
Fig.
6.— The SED of Object X as compared to that of IRC+10420 (Jones et al.
1993; Humphreys et al. 1997) and Var A (Humphreys et al. 2006). Both
comparison SEDs have been constructed using data from multiple epochs
(IRC+10420: UB from 1972, V RI from 1992, the rest from 1996; Var A:
optical from 2000-01, near-IR from 1997, the rest from 2004-05) and
these sources are known to be variable. We also note that there is AV ~
6 extinction in front of IRC+10420 (Jones et al. 1993) correcting for
which would make it more similar to Var A than Object X. However, it is
uncertain how much of the extincting material is associated with that
star rather than simply being along the line of sight, and therefore we
do not correct for the extinction here.
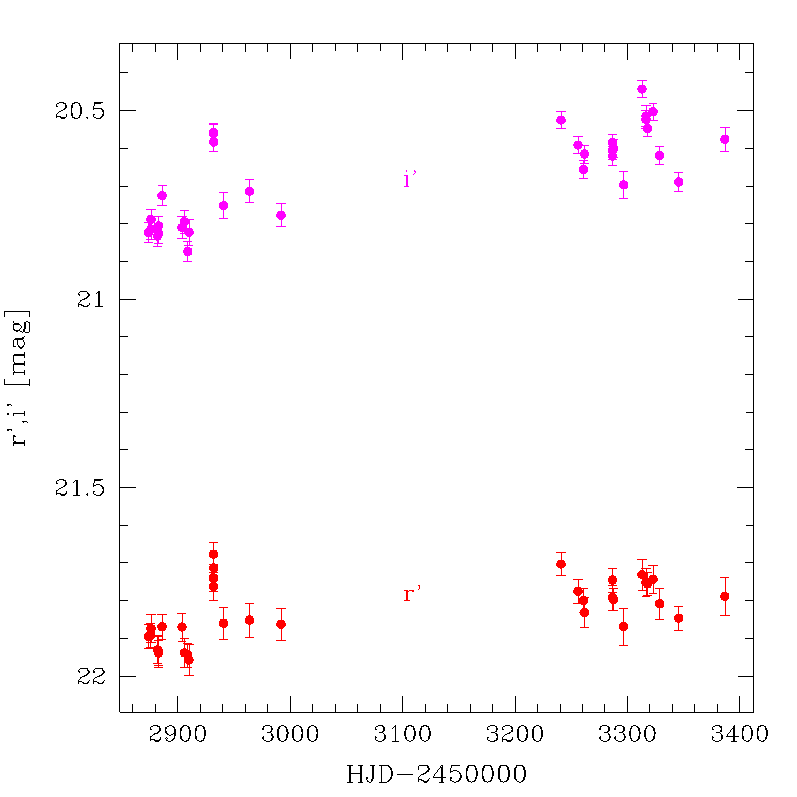
Fig.
7.— Optical variability of Object X in the r' and i' bands from Hartman
et al. (2006). Object X shows correlated variability of about ~0.4
magnitude (fractional variability of ~45%) in both bands.
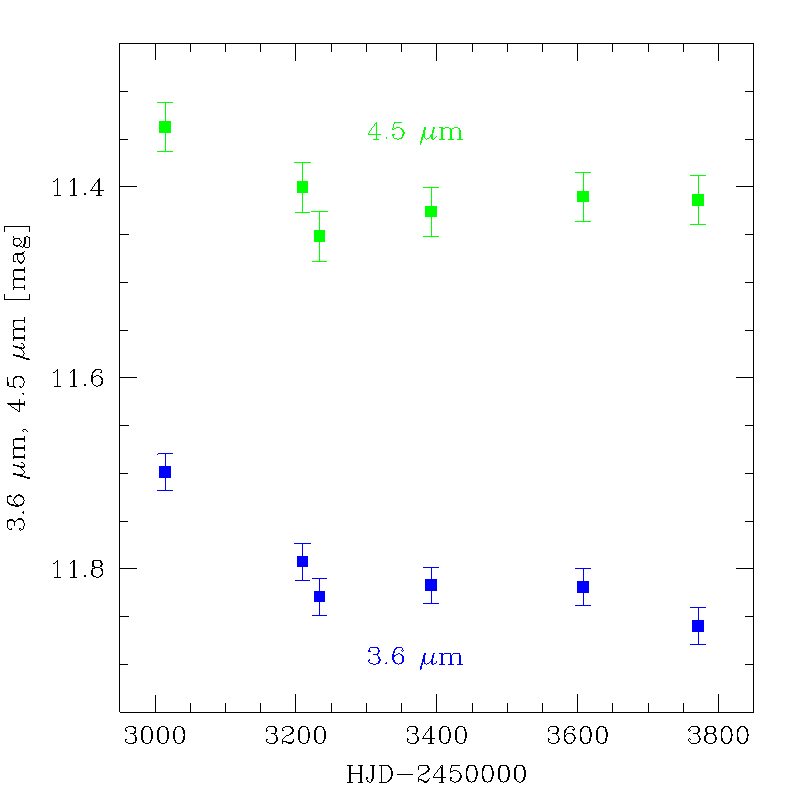
Fig.
8.— Mid-IR variability of Object X in the 3.6 um and 4.5 um IRAC bands.
It shows correlated variability of about ~0.15 magnitude (fractional
variability of ~15%) in both bands.
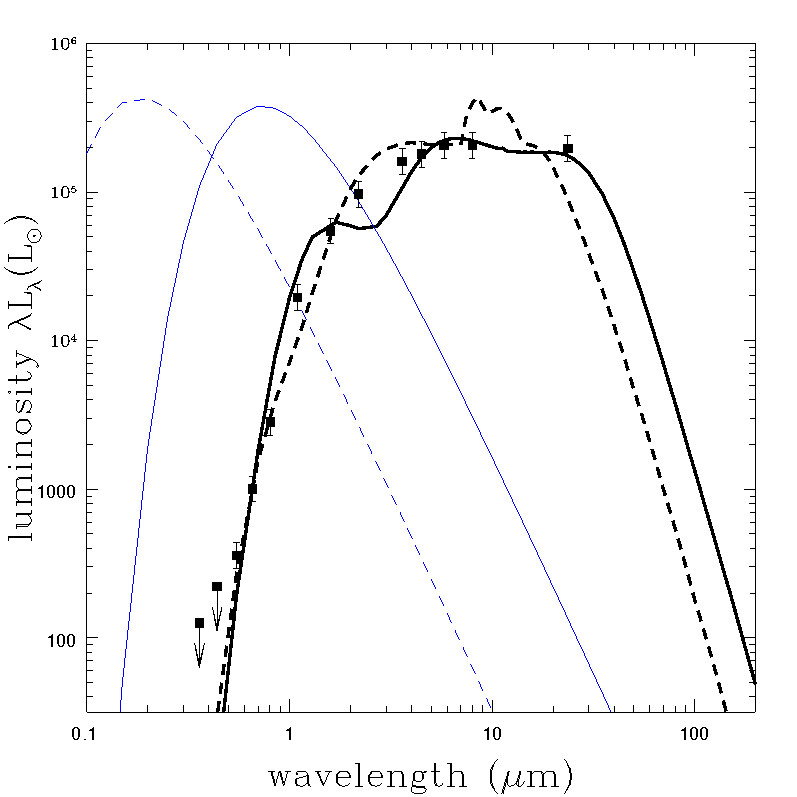
Fig.
9.— The results of DUSTY fits to Object X SED (black points). The heavy
solid (dashed) lines show the model DUSTY SEDs for the source for
graphitic (silicate) dusts. The light solid (dashed) lines show the
(black body) stellar SEDs.
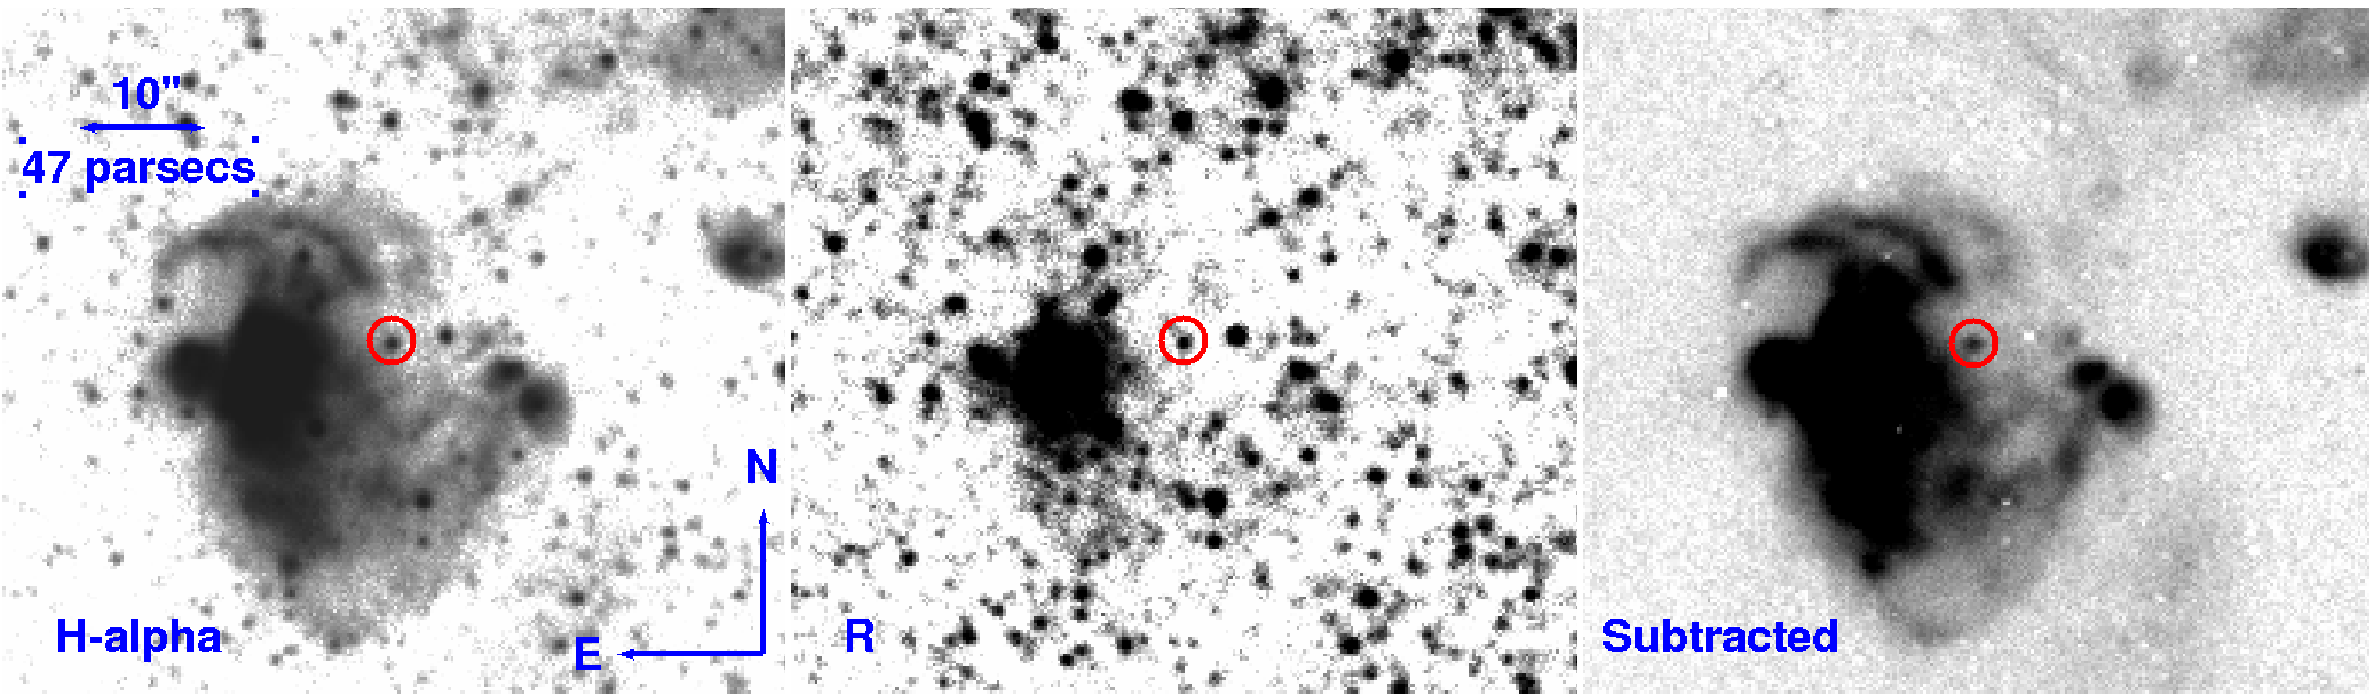
Fig.
10.— The H-alpha, R-band, and H-alpha minus R subtracted images of the
region near Object X. In the subtracted image, almost all the objects
vanish, leaving behind the nearby H II region, Object X, and a small
number of additional, mostly extended, H-alpha sources.
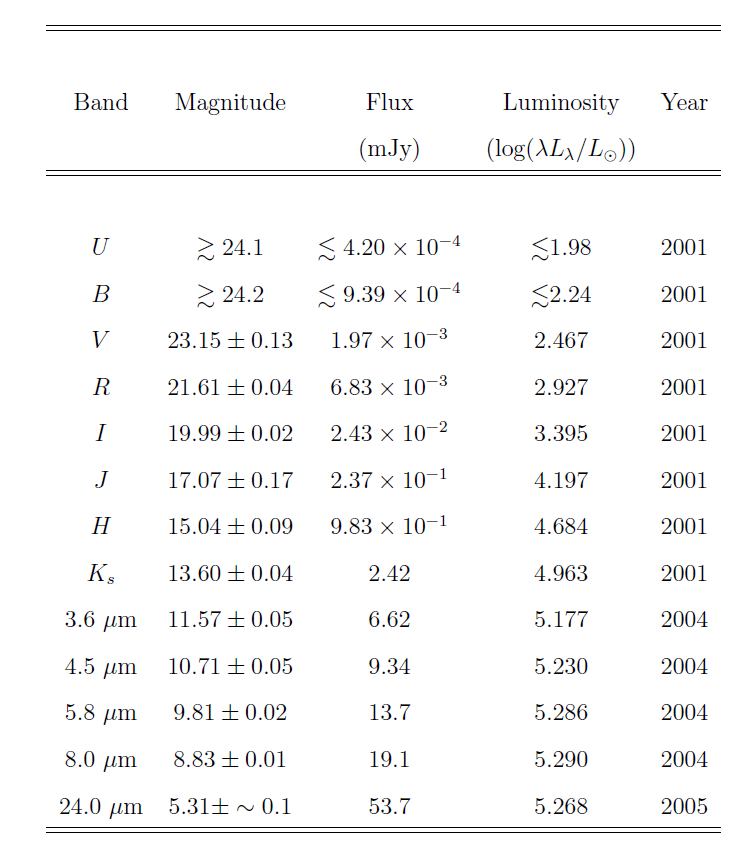
Table
1— Photometry of Object X. For computing the luminosity we used a
distance of0.96 Mpc (Bonanos et al. 2006) and corrected for Galactic
extinction of E(B - V ) = 0:049(Schlegel et al. 1998). The UBV RI
images are from Massey et al. (2006), the JHKs photometryis from Cutri
et al. (2003), the IRAC images from McQuinn et al. (2007), and theMIPS
24 um band image from the Spitzer archive (Program 5, PI:Gehrz).
Conclusions:
Stars like Object X are
extremely rare. As a unique star in a brief yet eventful evolutionary
state, we encourage further study of this interesting object.
Furthermore, there is mounting evidence that mass loss from massive
stars may be dominated by impulsive transients rather than steady winds
(e.g., Smith & Owocki 2006), particularly with the downward
revision of wind rates in recent years (e.g., Fullerton et al. 2006).
If so, the period in which mass loss is most important will also tend
to be the period when the star is most obscured. Surveys of massive
stars such as Massey et al. (2006) and Bonanos et al. (2009, 2010),
which focus on bright optical sources, will miss Object X and similar
sources that may best probe the frequency and duration of these mass
loss episodes as well as the amount of ejected mass. Characterizing
these stars and the order of mass loss by massive stars clearly
requires systematic surveys in the mid-IR as well as the optical.
Acknowledgements:
We thank J. L. Prieto, P. Gratier and R. Humphreys for their useful
advice, T. A.Thompson, B. Metzger and K. Sellgren for helpful
discussions, and D. Szczygiel for helping us analyze the MIPS
data. We extend our gratitude to the SINGS Legacy Survey and LVL Survey
for making their data publicly available. This research has made
use of NED, which is operated by the JPL and Caltech, under
contract with NASA and the HEASARC Online Service, provided by
NASA's GSFC. This research has made use of photographic data of
the National Geographic Society -- Palomar Observatory Sky Survey
(NGS-POSS) obtained using the Oschin Telescope on Palomar Mountain.
The NGS-POSS was funded by a grant from the National Geographic
Society to the California Institute of Technology. The Digitized Sky
Survey was produced at the Space Telescope Science Institute under US
Government grant NAG W-2166. RK and KZS are supported in part by NSF
grant AST-1108687. KZS and CSK are supported in part by NSF grant
AST-0908816. AZB acknowledges research and travel support from the
European Commission Framework Program Seven under a Marie CurieInternational Reintegration Grant.