ABELL 3391 in 72019000

Note that I don't update the images all that often, even after I change things like the regions or fit parameters, so sometimes the images shown might not match the information given.

Cluster Images
Below are the summed, smoothed, and exposure corrected images for the GIS and SIS. The images were smoothed with a Gaussian of 1.5 pixels. The regions inside the solid green lines were extracted for the source spectrum. Red, dashed lines enclose regions excluded.
ABELL_3391_72019000 smoothed images
RA: 96.5958 DEC: -53.6995 Rext: 13.13 arcmin

Radial Profile
We chose the extraction regions based on an exposure corrected, combined GIS-2 and GIS-3 sky image. Reference sky coordinates from the literature were used as input to a centroid routine to determine the cluster center right ascension and declination. A radial emission profile was then constructed from this position. Note that this radial profile does not reflect the true cluster profile given the complicated PSF of the ASCA mirrors and the GIS detector.

The background (and sigma of the background) was iterative determined by stepping inward from the end of the profile and averaging (using a three sigma clipping algorithm). The extraction region was chosen to be the radius at which the radial profile reached 5*sigma times the background level.

The radial profile is shown below. The red line is the background level. The blue line is the 5*sigma level. SIS extaction radii were set at 0.70 times the GIS extraction radius.

ABELL_3391_72019000 radial
			profile

Detector Images
Below are images of each detector showing the region file used for that instrument. The images are smoothed with a Gaussian of 1.5 pixels and are not exposure corrected. The regions inside the solid green circle were extracted for the source spectrum. Regions inside dashed red circles were excluded from the source and background detections. Note that the current version of XIMAGE does not correctly display the ellipse and polygon regions used to define non-detector regions and SIS chips.
ABELL_3391_72019000 smoothed images

Optical Image
An overlay of GIS contours on optical Digitized Sky Survey images for the GIS source region (as indicated by the circle). This is not yet perfected so some of these images may look screwy.
ABELL_3391_72019000 GIS/DSS overlay

The X-ray Spectrum
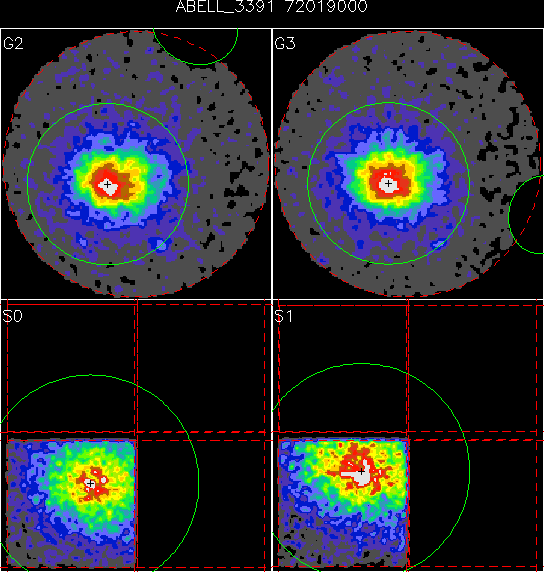
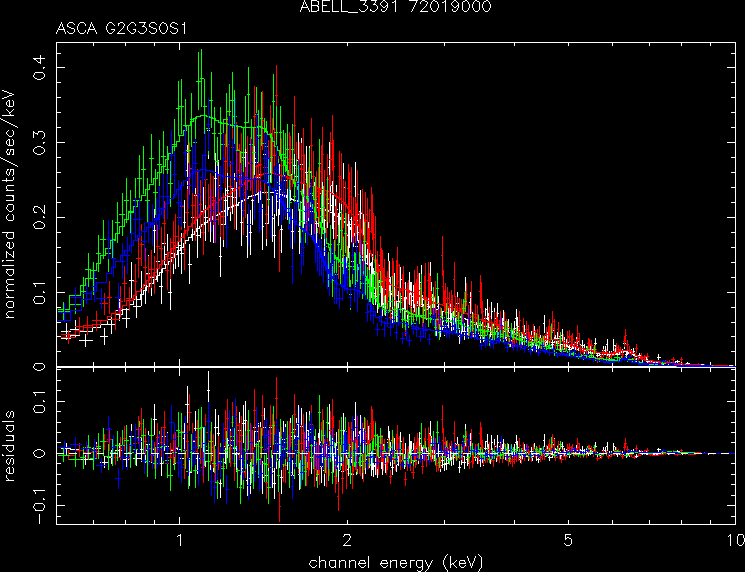
The x-ray spectrum of the cluster for a single temperature MEKAL fit, the residuals of the fit, and the fit parameters. Note that the spectrum from 0.6 to 10 keV is shown for each instrument although a smaller range of energies was usually fitted (e.g., 0.8 to 8.0 keV for the GIS and 0.6 to 8.0 keV for the SIS). The data points (lines) in white, red, green, and blue represent the data for each instrument (or corresponding model) in the order they were read into XSPEC, usually G2, G3, S0, S1.
ABELL_3391_72019000 spectrum
nh20 Tx 90% c.l. Zsolar 90% c.l. z fx(0.5-2.0) Lbol lvir chisq dof
5.51 6.07  (5.83-6.33) 0.36  (0.30-0.43) 0.0514 1.38e-11 5.62e+44 1.15 1.19 964

Other Information and Data
NED ADS W3B W3B-A0s


NASA Logo, National Aeronautics and Space Administration
Goddard