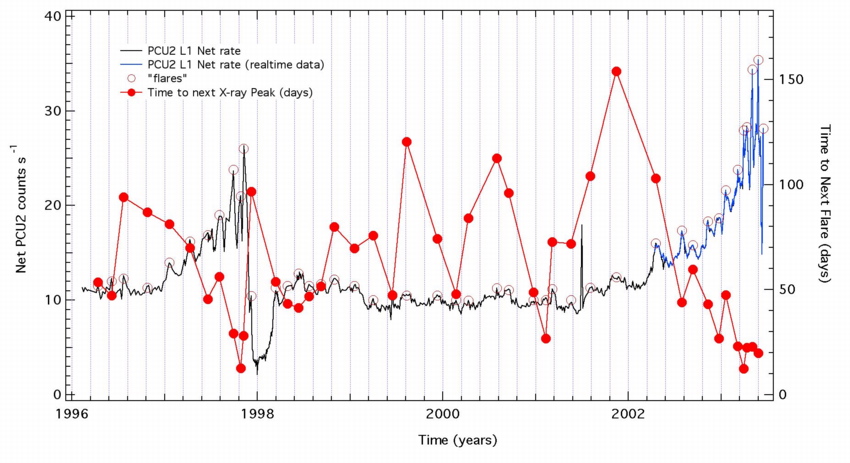
The RXTE X-ray Lightcurve of Eta Carinae
 |  |  |
Click on the images above to view the RXTE Eta Car lightcurve.
Swift Processed observations through 2013-07-23.
RXTE Quicklook observations through 2009-04-18.
Phases are calculated according to the following ephemeris:
Schedule of RXTE observations of Eta Car
Changes
- 2004-Apr-22: The net rates are now calculated using the corrected PCU2 faint background models. See http://heasarc.gsfc.nasa.gov/docs/xte/pca_news.html for more details.
- 2007-Sep-21: The net rates are corrected for problems with gaps in the SAA history file and problems in the background model. See the report PCA SAA History and Background Problems for more details.
Flare timings
Observation to Observation Differences
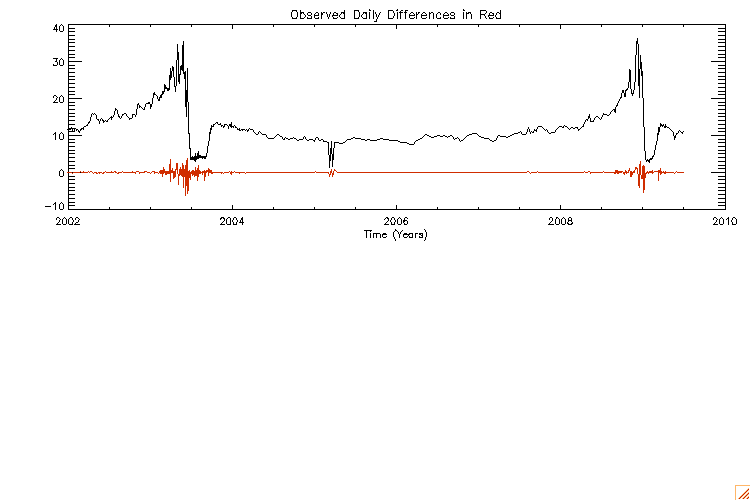
Cycle 1 and 2 detailed comparison
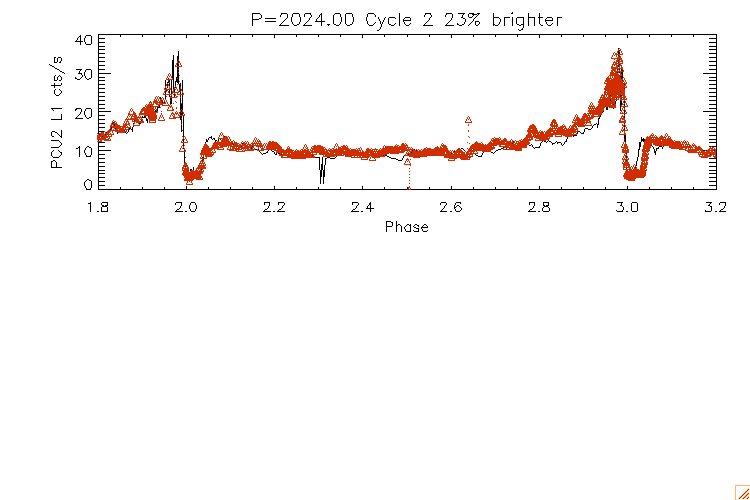
Variation of NH and observed 2-10 keV flux from analysis of the RXTE spectra
Information about the 2003.5 X-ray eclipse/"shell event" observing campaign
The schedule of RXTE observations of Eta Car
General Information about X-ray observations of Eta Car
Page Author: Dr. Mike Corcoran
Last modified Tue, May 21, 2013 7:28:26 AM