A gigantic flare from the star, Cluster Trumpler
14 Y 422, in the Carina nebula
Summary
- XMM-Newton, NuSTAR and Swift observations of the Carina star
forming complex detected an X-ray flare from the star, Trumpler
14 Y 442, on 2015 July 16.
Investigators
- Kenji Hamaguchi (CRESST NASA/GSFC & UMBC)
- Stephen A. Drake, Michael F. Corcoran (CRESST NASA/GSFC &
USRA)
- Mairan Teodoro (NASA/GSFC, Western Michigan University &
CNPq)
- Noel Richardson (Universite de Montreal)
X-ray Observations in 2015
- July 16
- XMM-Newton (ObsID: 0762910401, exp: 11.5 ksec, elapsed time:
~11.5 ksec)
- NuSTAR (ObsID: 30101005002, exp: 23.6 ksec, elapsed time:
~38.7 ksec)
- Swift (ObsID: 00081578001, exp: 2 ksec, elapsed time: 5.8
ksec)
- July 28-31
- Swift (ObsID: 00031097045-7, exp: 4.6 ksec)
- August 21
- Swift (ObsID: 00031097049, exp: 9.1 ksec)
Parameters of the flare source
- (R.A., Dec)[J2000] = (10 44 02.80, -59 39 46.7)
- Measured from the XMM-Newton MOS images on July 16
- 0.3" from the star, Trumpler 14 Y 442 (SIMBAD)
- Fx [0.5-10 keV] = 4.67e-12 ergs s-1 cm-2 on July 16 (during
the XMM-Newton observation)
- Lx = 2.96e+33 ergs s-1 assuming the distance at the Carina
nebula (2.3 kpc)
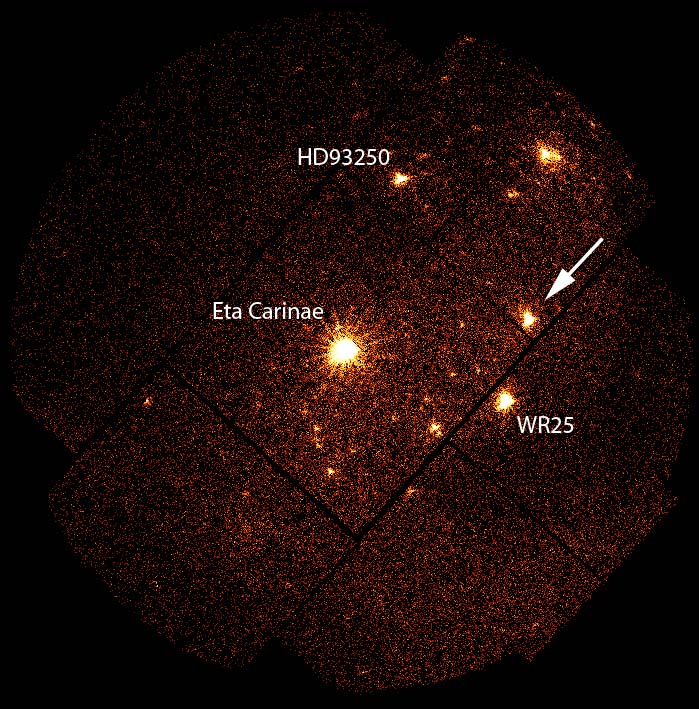
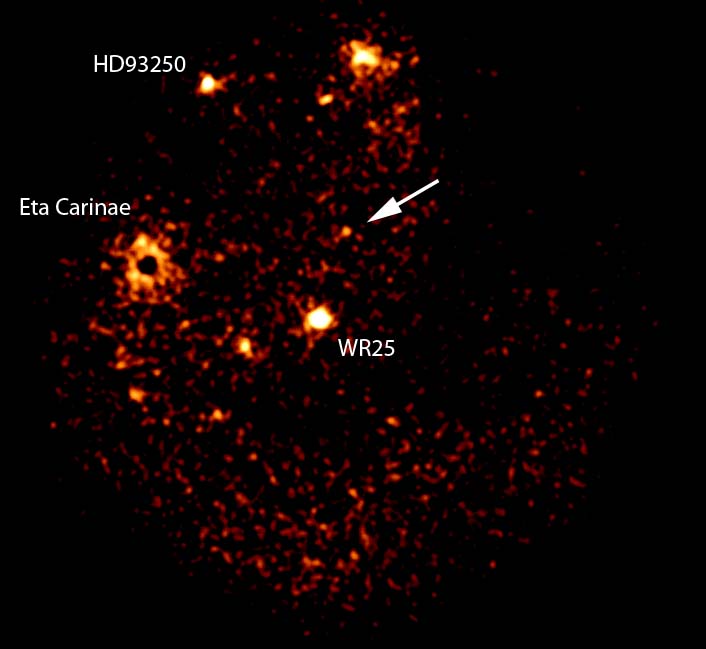
X-ray Image
- XMM-Newton EPIC/MOS2 image on July 16 (0.3-10 keV: left)
and Swift XRT image on July 28-31 (0.3-8 keV: right).
- The white arrow on the image points at the flare source.
- On the Swift image, Eta Carinae has a black spot at the
center due to photon pile-ups.
X-ray light curves
- NuSTAR/FPMA+B 3-25 keV light curve (0.3-10 keV, top)
and XMM-Newton 0.3-10 keV light curve (3-25 keV: bottom)
on July 16
X-ray spectra
- Simultaneous fit to the XMM-Newton and NuSTAR spectra on July
16
- Model: apec * TBabs
- The model normalizations for the XMM-Newton and NuSTAR
spectra are varied because the flux changed through the
observation.
- Z = 1.0 solar (frozen)
- Best-fit result:
- kT = 8.3 (7.5-9.7) keV
- nH = 1.9e21 (1.6e21-2.2e21) cm-2
- reduced chi-square: 0.95 (dof = 283)
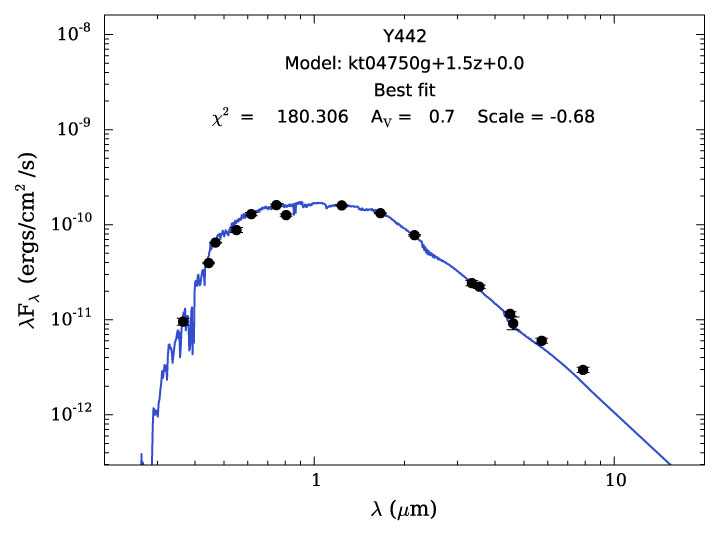
UV/Optical/IR data
- Photometric data
- UBVI (Johnson)
- GRI (Sloan SDSS)
- JHK (2MASS)
- [3.6, 4.5, 5.8, 8.0] um (Spitzer IRAC)
- [3.4, 4.6] um (WISE)
- Model
- Best-fit result